Dashboard
The dashboard presents a set of tiled metrics based on the current snapshot of articles accessible for the logged on user including:
- Article count total
- Article published total
- Article Expiring total (will expire in the future)
- Article Expired total (already expired in the past)
- Articles in the Review Status total (needs attention)
- Articles in Draft status total
Additional tiles include search performance metrics:
- Percentage count of searches that matched content
- Percentage count of searches that did not yield any results (no matches)
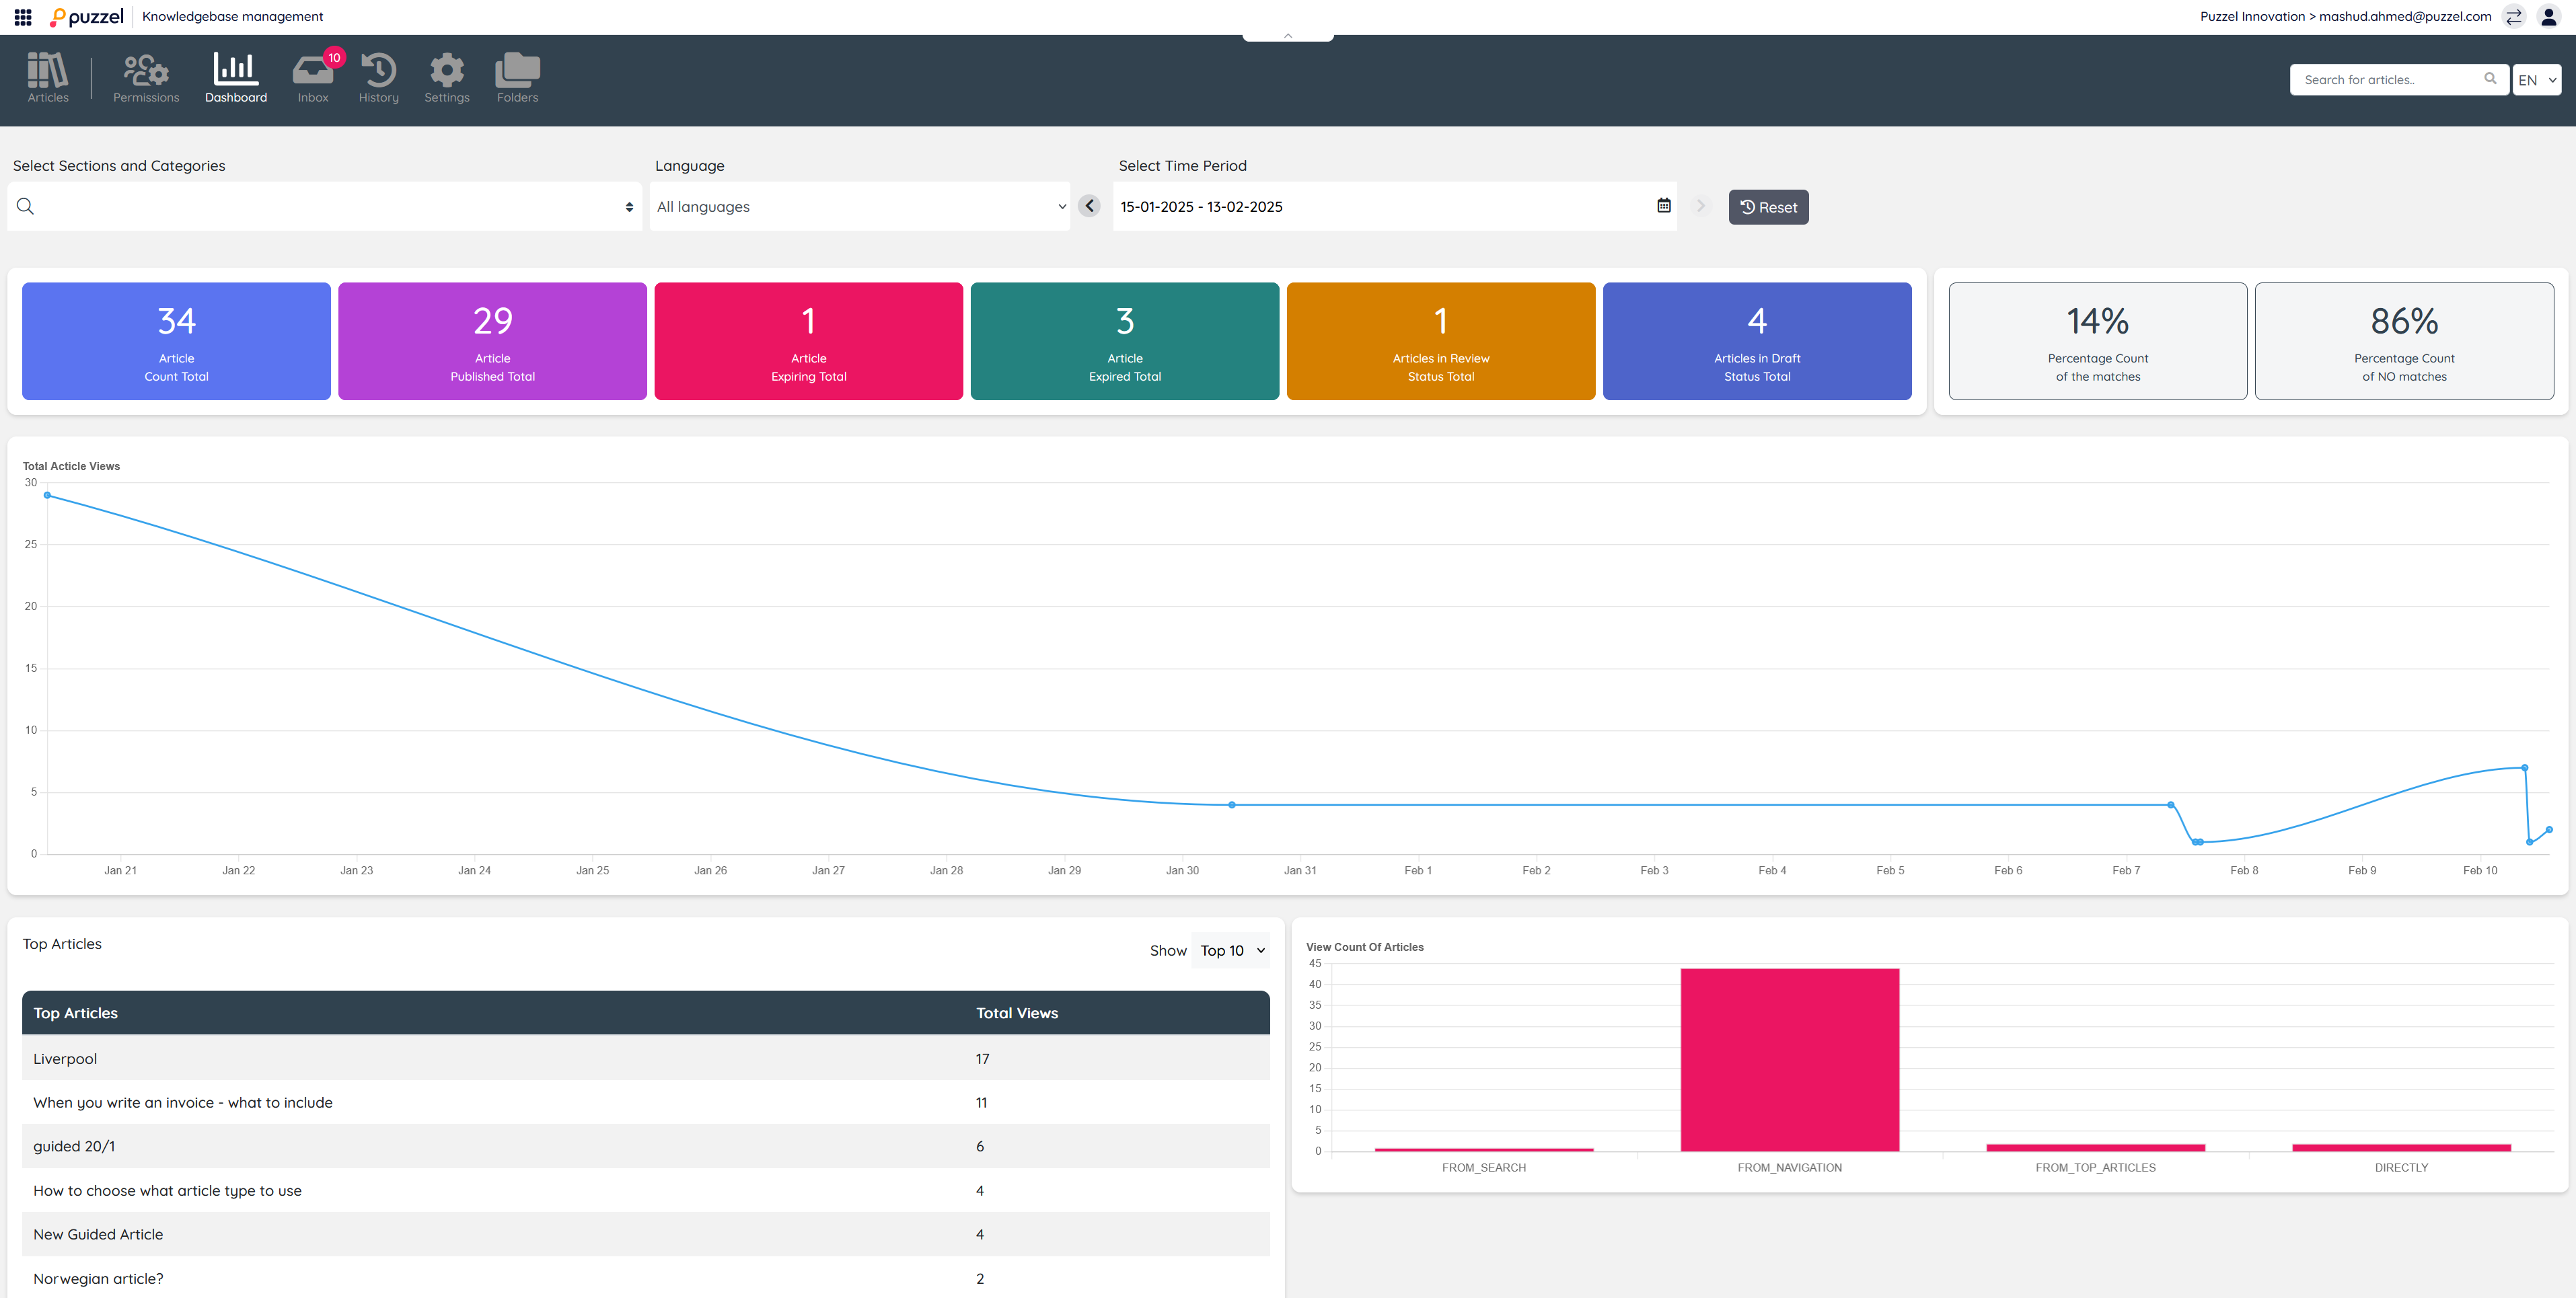
It is possible to filter the dashboard data based on a selection of Categories and sections, language and a date-time range. Changes to the filtering constraints will display updated metrics on the search performance tiles, the Article views chart, the top article views table and the bar chart of view sources.
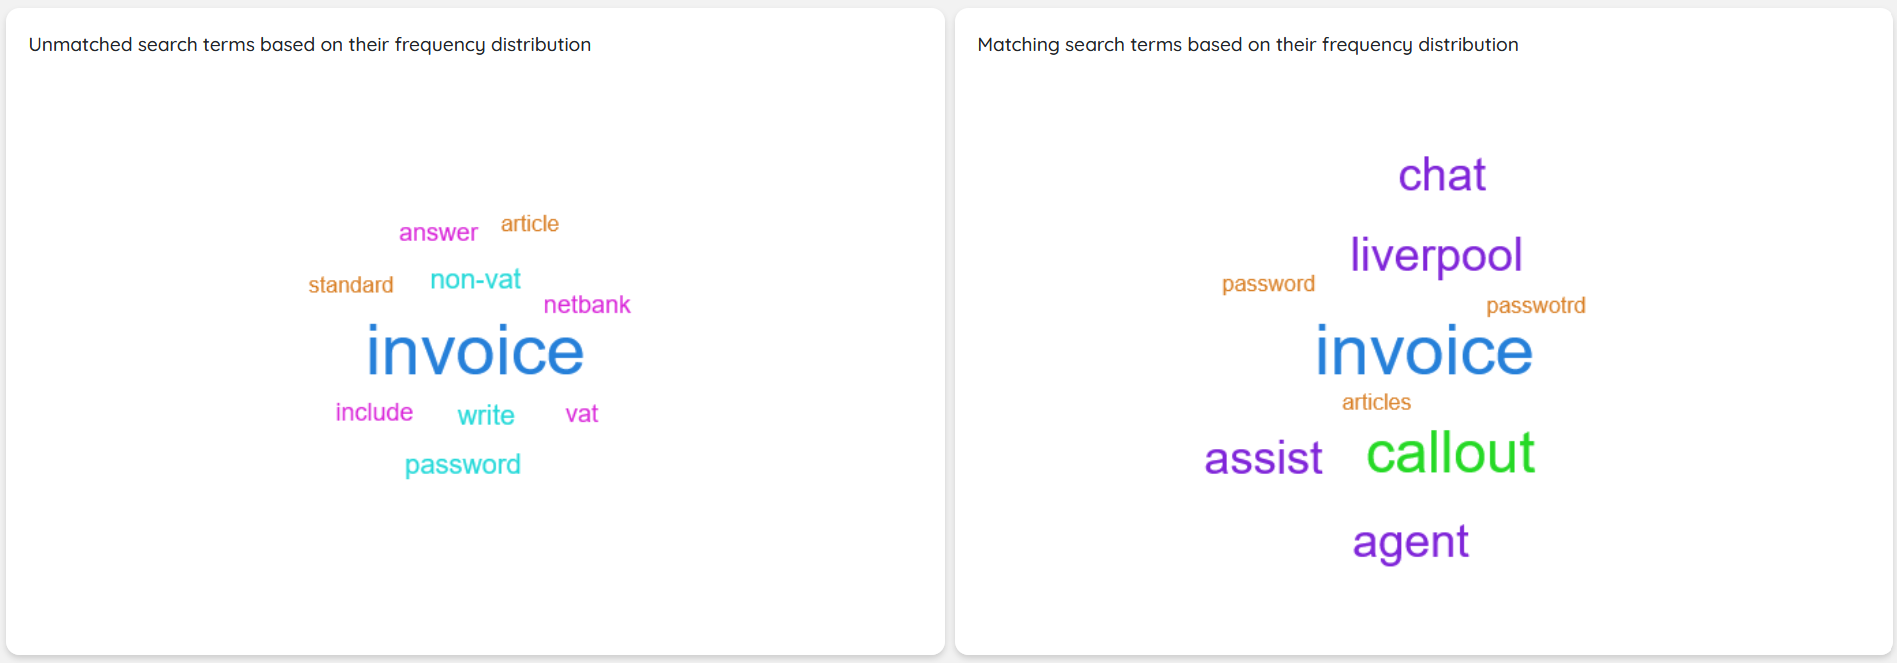
Search performance is also visualised in the form of wordclouds with the frequency distribution of the matching and non matching terms for any given date range.