Statistics
Statistics Page
Overview
The Statistics page helps you understand how your Virtual Agent is performing. You can quickly answer questions like:
- How many chats has the Virtual Agent handled over a given period?
- How many of those chats were resolved by the bot?
- What percentage of chats were covered by flows?
Before using the Statistics page, make sure to configure node interpretations.
Configuring Node Interpretations
To set up your statistics:
- Go to the Statistics page.
- Click the three dots menu in the top-right corner.
- Select Statistics settings.
Here, you’ll define which nodes fall into these categories:
- Master nodes: Classify the user’s intent (e.g. when the bot identifies what the user is asking about).
- Opt-out nodes: Handle cases where a user chooses to leave or transfer (e.g. “I want to speak to an agent”).
- Flow nodes: Represent entry points into designed flows that solve user problems.
- Transfer nodes: Track when a conversation is handed off (to an agent, ticket system, or other channel).
Viewing Chatbot Performance
To view performance data:
- Go to Statistics in the left-hand panel.
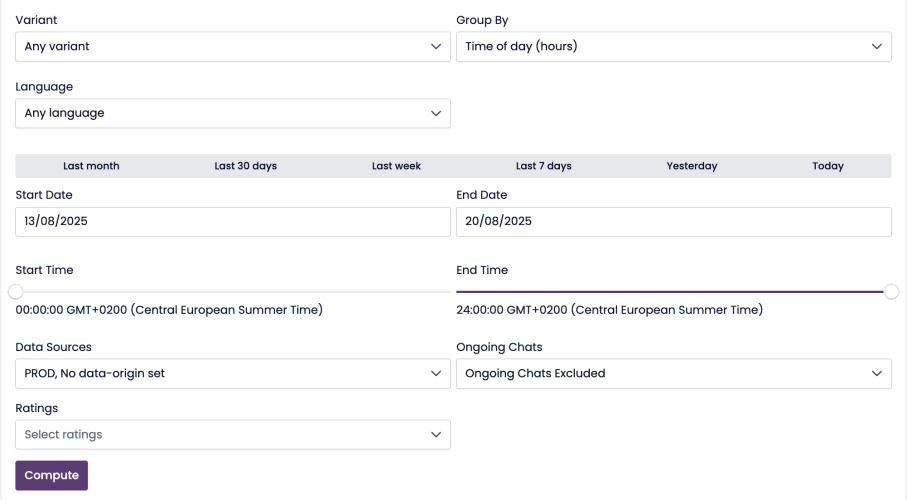
- Adjust the filters at the top:
- General vs Details view
- Variant (if using A/B variants)
- Group by (time period or granularity)
- Language
- Date/time range
- Data source (e.g., production or test environment)
- Click Compute statistics to generate the results.
- (Optional) Click Download statistics to export as CSV.
General Overview
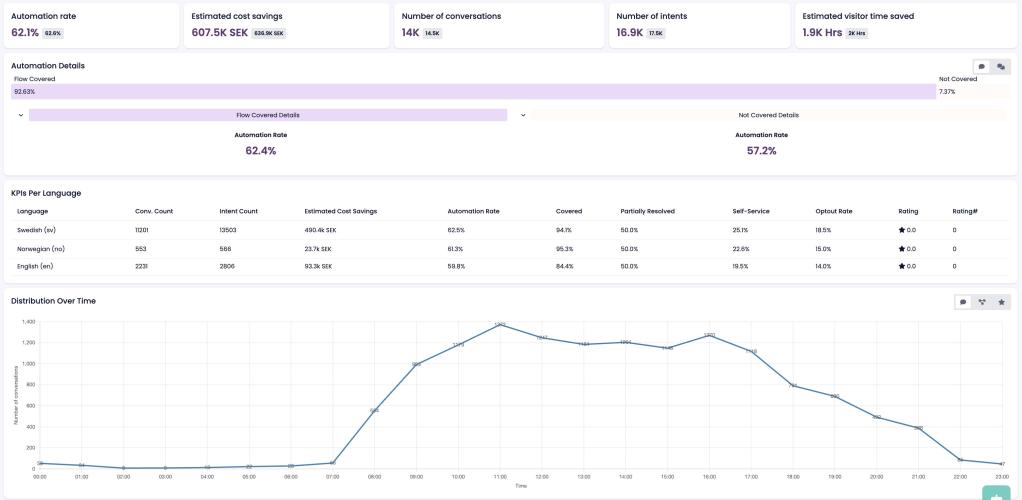
The General tab gives you a high-level view of key metrics:
- Automation rate – Percentage of conversations handled automatically.
- Estimated cost savings – Based on average handling cost and automation rate.
- Number of conversations – Total in the selected timeframe.
- Number of intents – Total intents detected (based on master nodes).
- Estimated visitor time saved – Time saved compared to agent response times.
- Flow covered – Conversations handled through configured flows.
- Not covered – Conversations the bot could not resolve.
- Self-service rate – Percentage of chats that did not require transfer.
- Partially automated conversations – Conversations where the bot provided partial help before transfer.
- Partial resolution rate – How effectively the bot prepared the case for handover.
- KPIs per language – Breakdown of performance per language.
- User satisfaction – Ratings (1–5 stars or thumbs up/down).
Detailed Overview
The Details tab provides more granular statistics:
- Impacted conversations – Percentage of chats where the bot had meaningful interaction.
- Average user messages – Average number of messages from users.
- Average bot messages – Average number of responses from the bot.
- Average integrations used – Number of integrations triggered (e.g. password reset, lookup).
Node Details
In the Node details section, you can create groups of nodes to track performance at a more detailed level:
- Click + Add group.
- Name the group and add relevant nodes.
- Recompute statistics to see KPIs for that group.
- Export results as Excel for further analysis.
Node Visits
The Node visits section shows how often each node was triggered during the selected period:
- Add nodes using the search field.
- Compute statistics to view visit counts and fractions of total chats.
- Favorite nodes to keep them at the top of the list.
Statistics by Start URL
If your bot runs in SupChat, Puzzel Chat, or Zendesk Chat, you can group statistics by the URL where the chat started.


