
Queues view
Please note, this documentation is referring to functionality for which an End of Life has been announced. The announcement can be found here, and the new product documentation is available here.
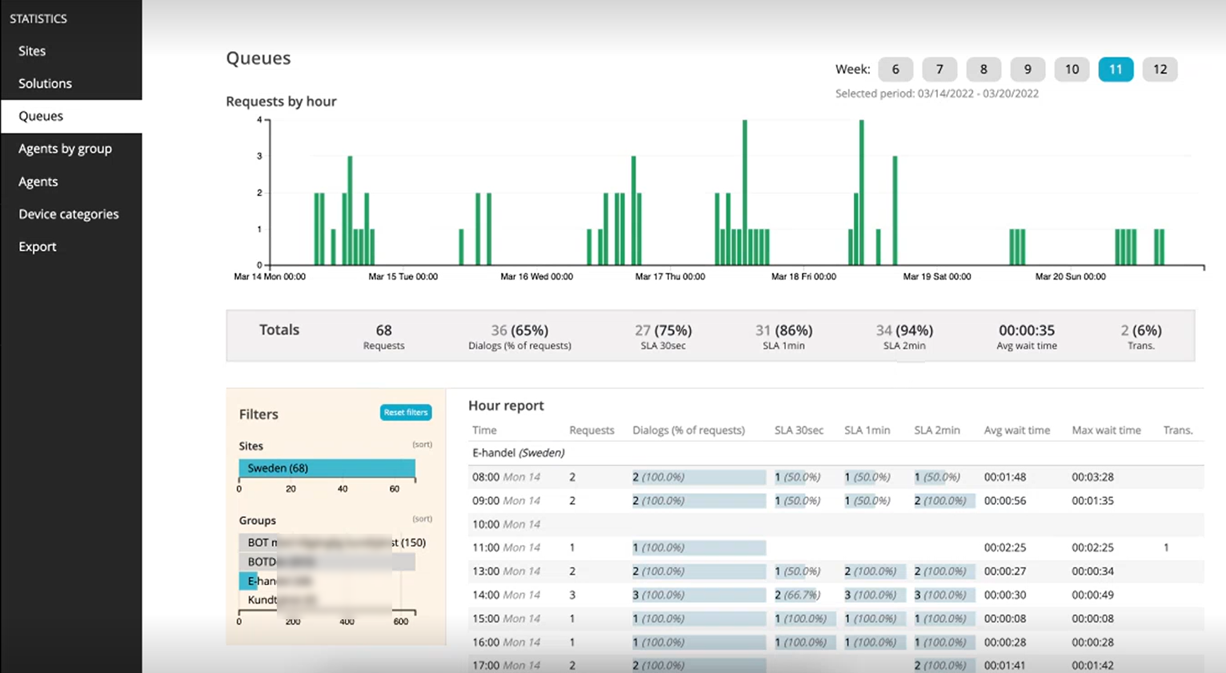
Depending on the configuration of your Puzzel Digital Engagement solution and the area of interest marked in it, agents can be working in one or more queues/groups based on their competence. For example, a site can have different Queues/Groups for Sales,marketing, and Support and an agent could have logged on to both sales and marketing queues. In the aggregate bar you can view SLA for 30 seconds, 1 min and 2 mins that suggests how many people received help within that time frame. The data also displays Avg wait time that implies customers received help under 35 secs.
| Metrics | Definition |
|---|---|
| Requests | Number of visitors that entered the queue [transfers not included] |
| Dialogs (% of requests) | Number of dialogs selected from queue [transfers not included]. The percentage of visitors that got help. |
| SLA 30 sec, 1 min and 2 min | Number of visitors selected from the queue within the given timeframe |
| Avg wait time | Average wait time of a visitor from the time they entered the queue to being selected by an agent |
| Trans. ( transferred) | Number of visitors who has been in a dialog but has been transferred to another group/queue. Note that a dialog transferred will count as two dialogs |