Sales Intelligence Dashboard
Sales Intelligence Dashboard
Gradually rolling out in November 2024
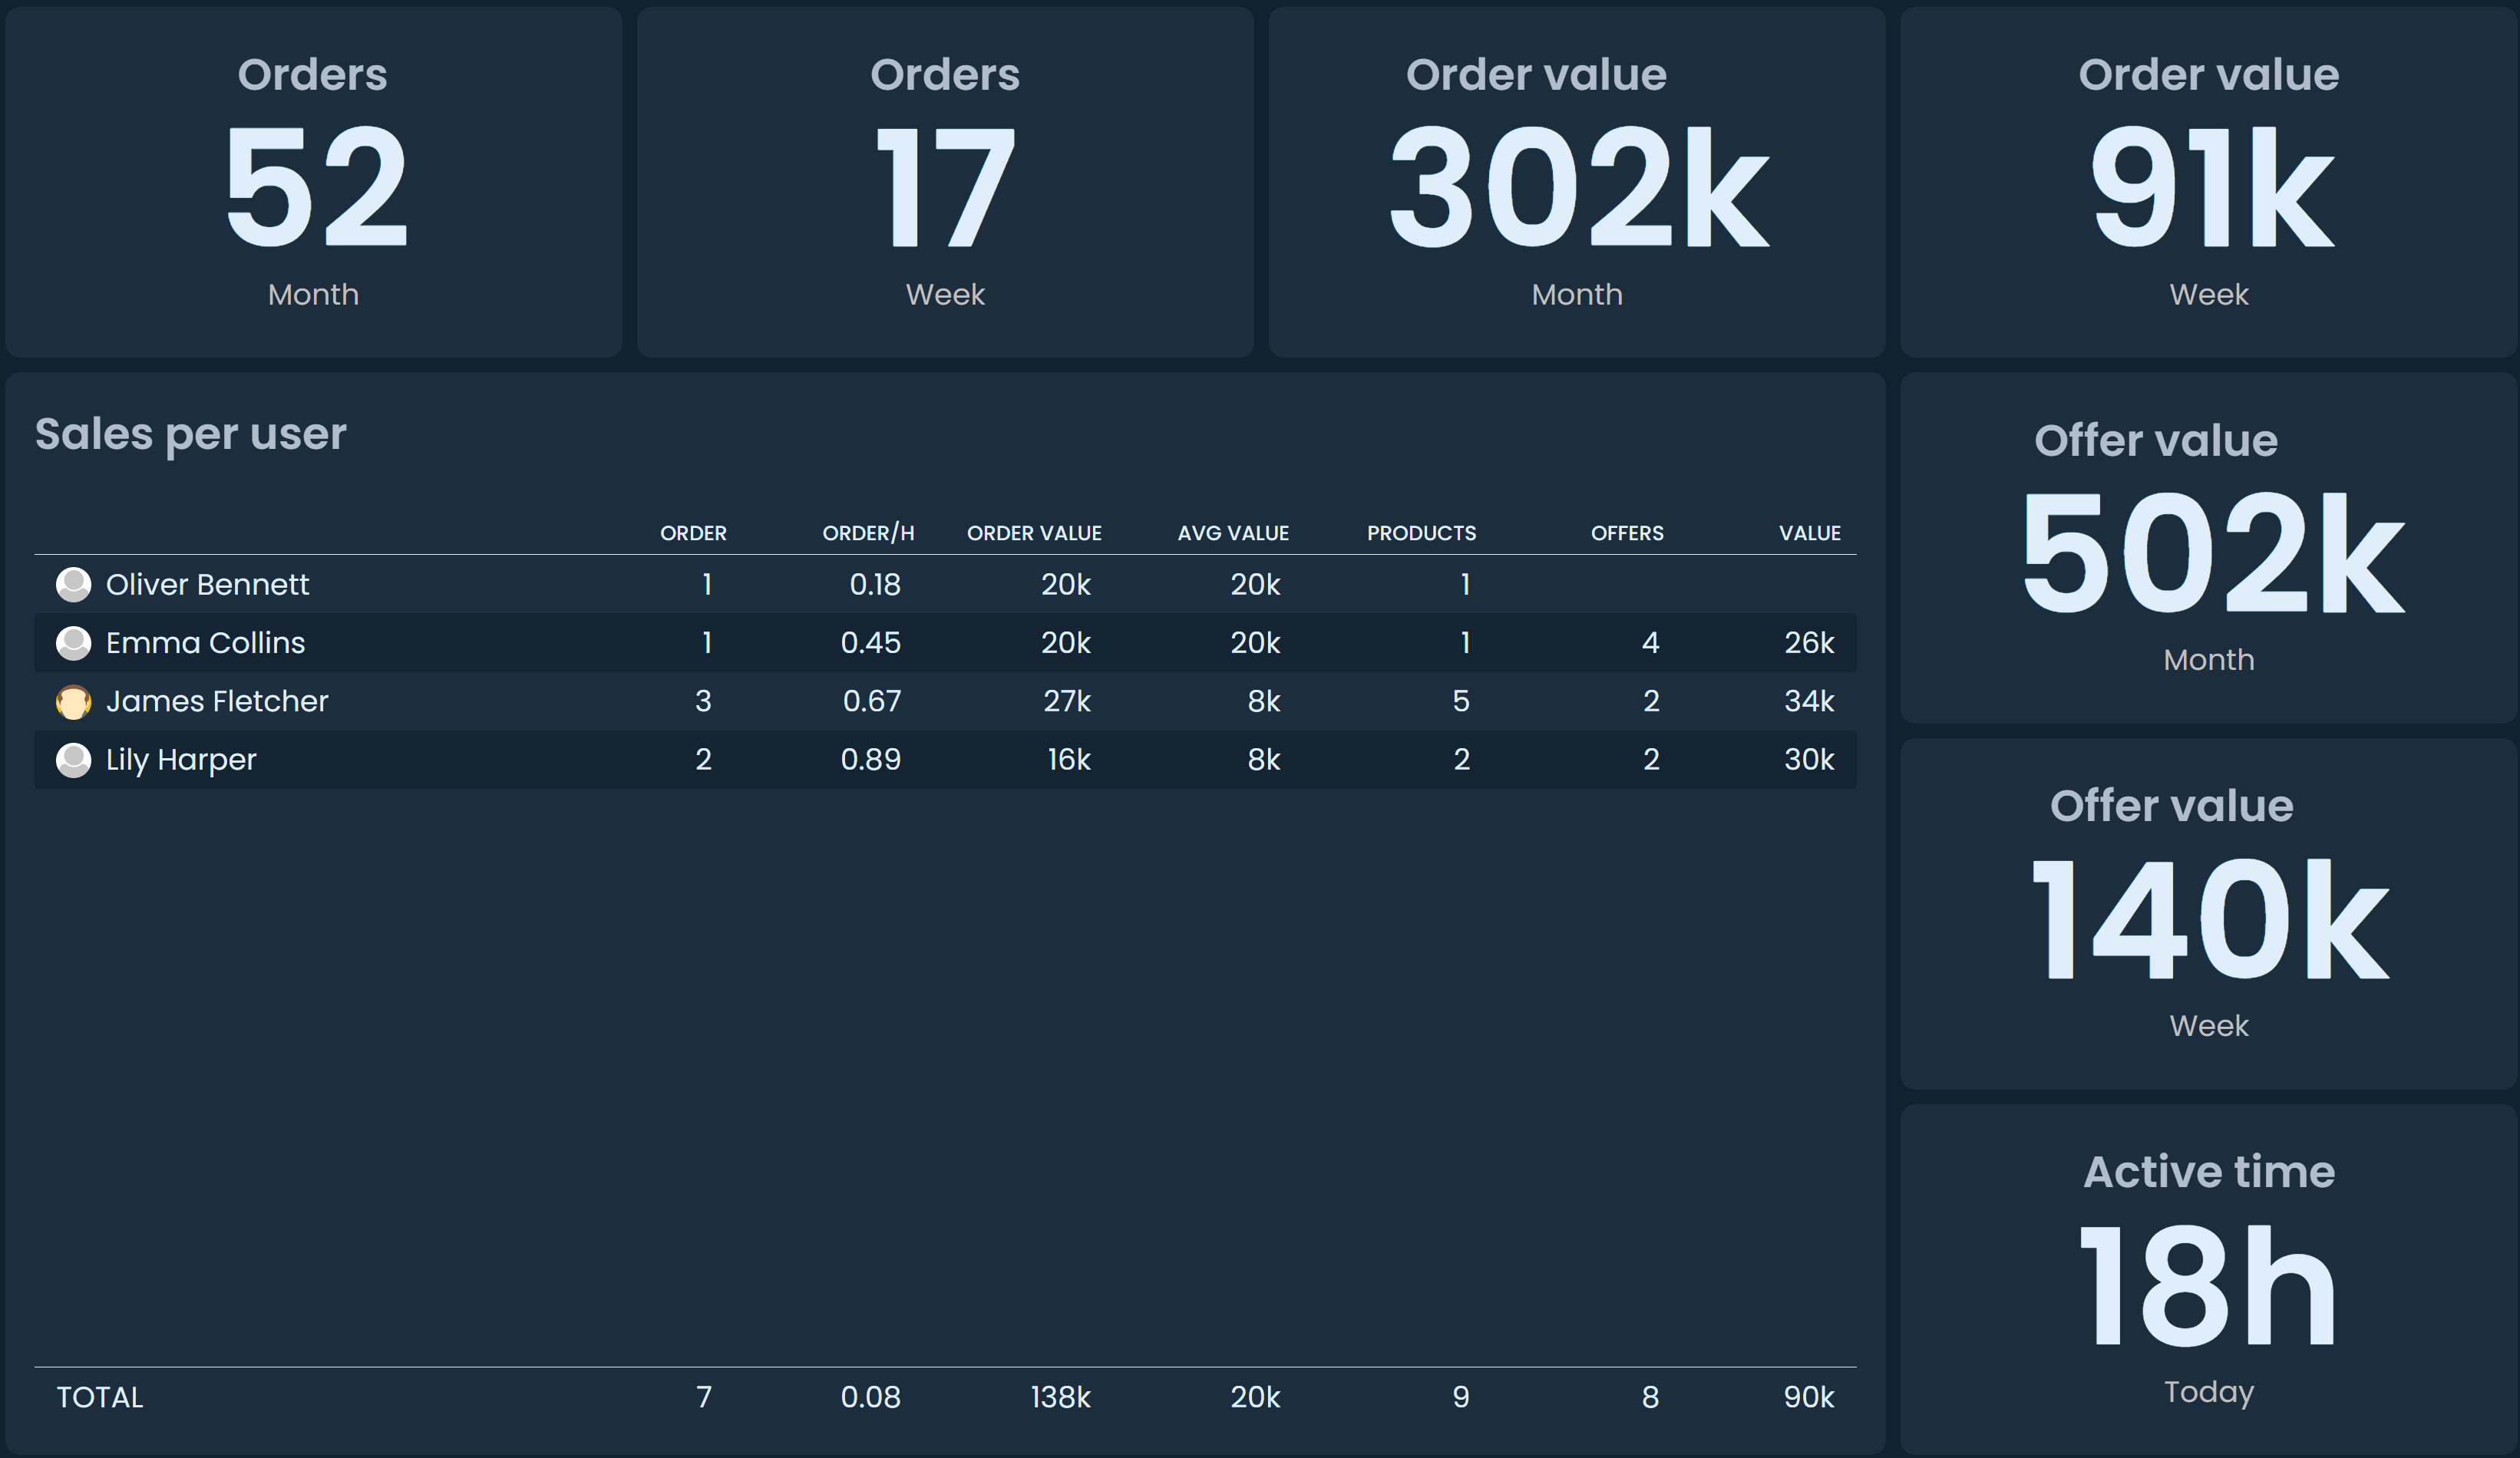
The dashboard provides a new, modern interface, simpler setup tools, and great options for customization it to suit your needs. Most dashboard KPIs and lists are updated in real time, while some update with a slight delay.
- To start using the dashboard, navigate to the dashboard tab in the admin menu.
- Click the +button to create a new Dashboard.
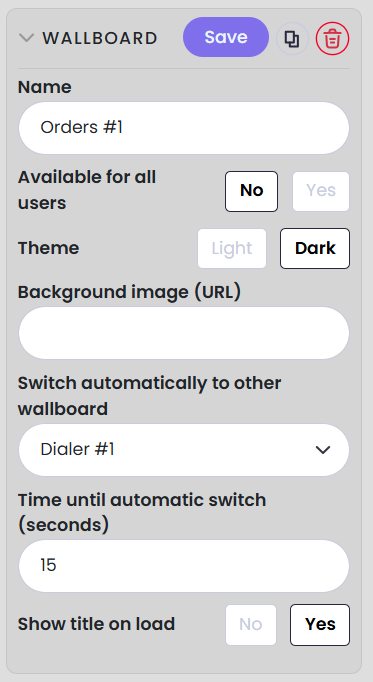
When editing a dashboard you can:
- Set a name
- Make the dashboard available for yourself or for all users
- Choose a theme
- Add a background image by entering any HTTPS URL from the internet
- Create a loop of different dashboards
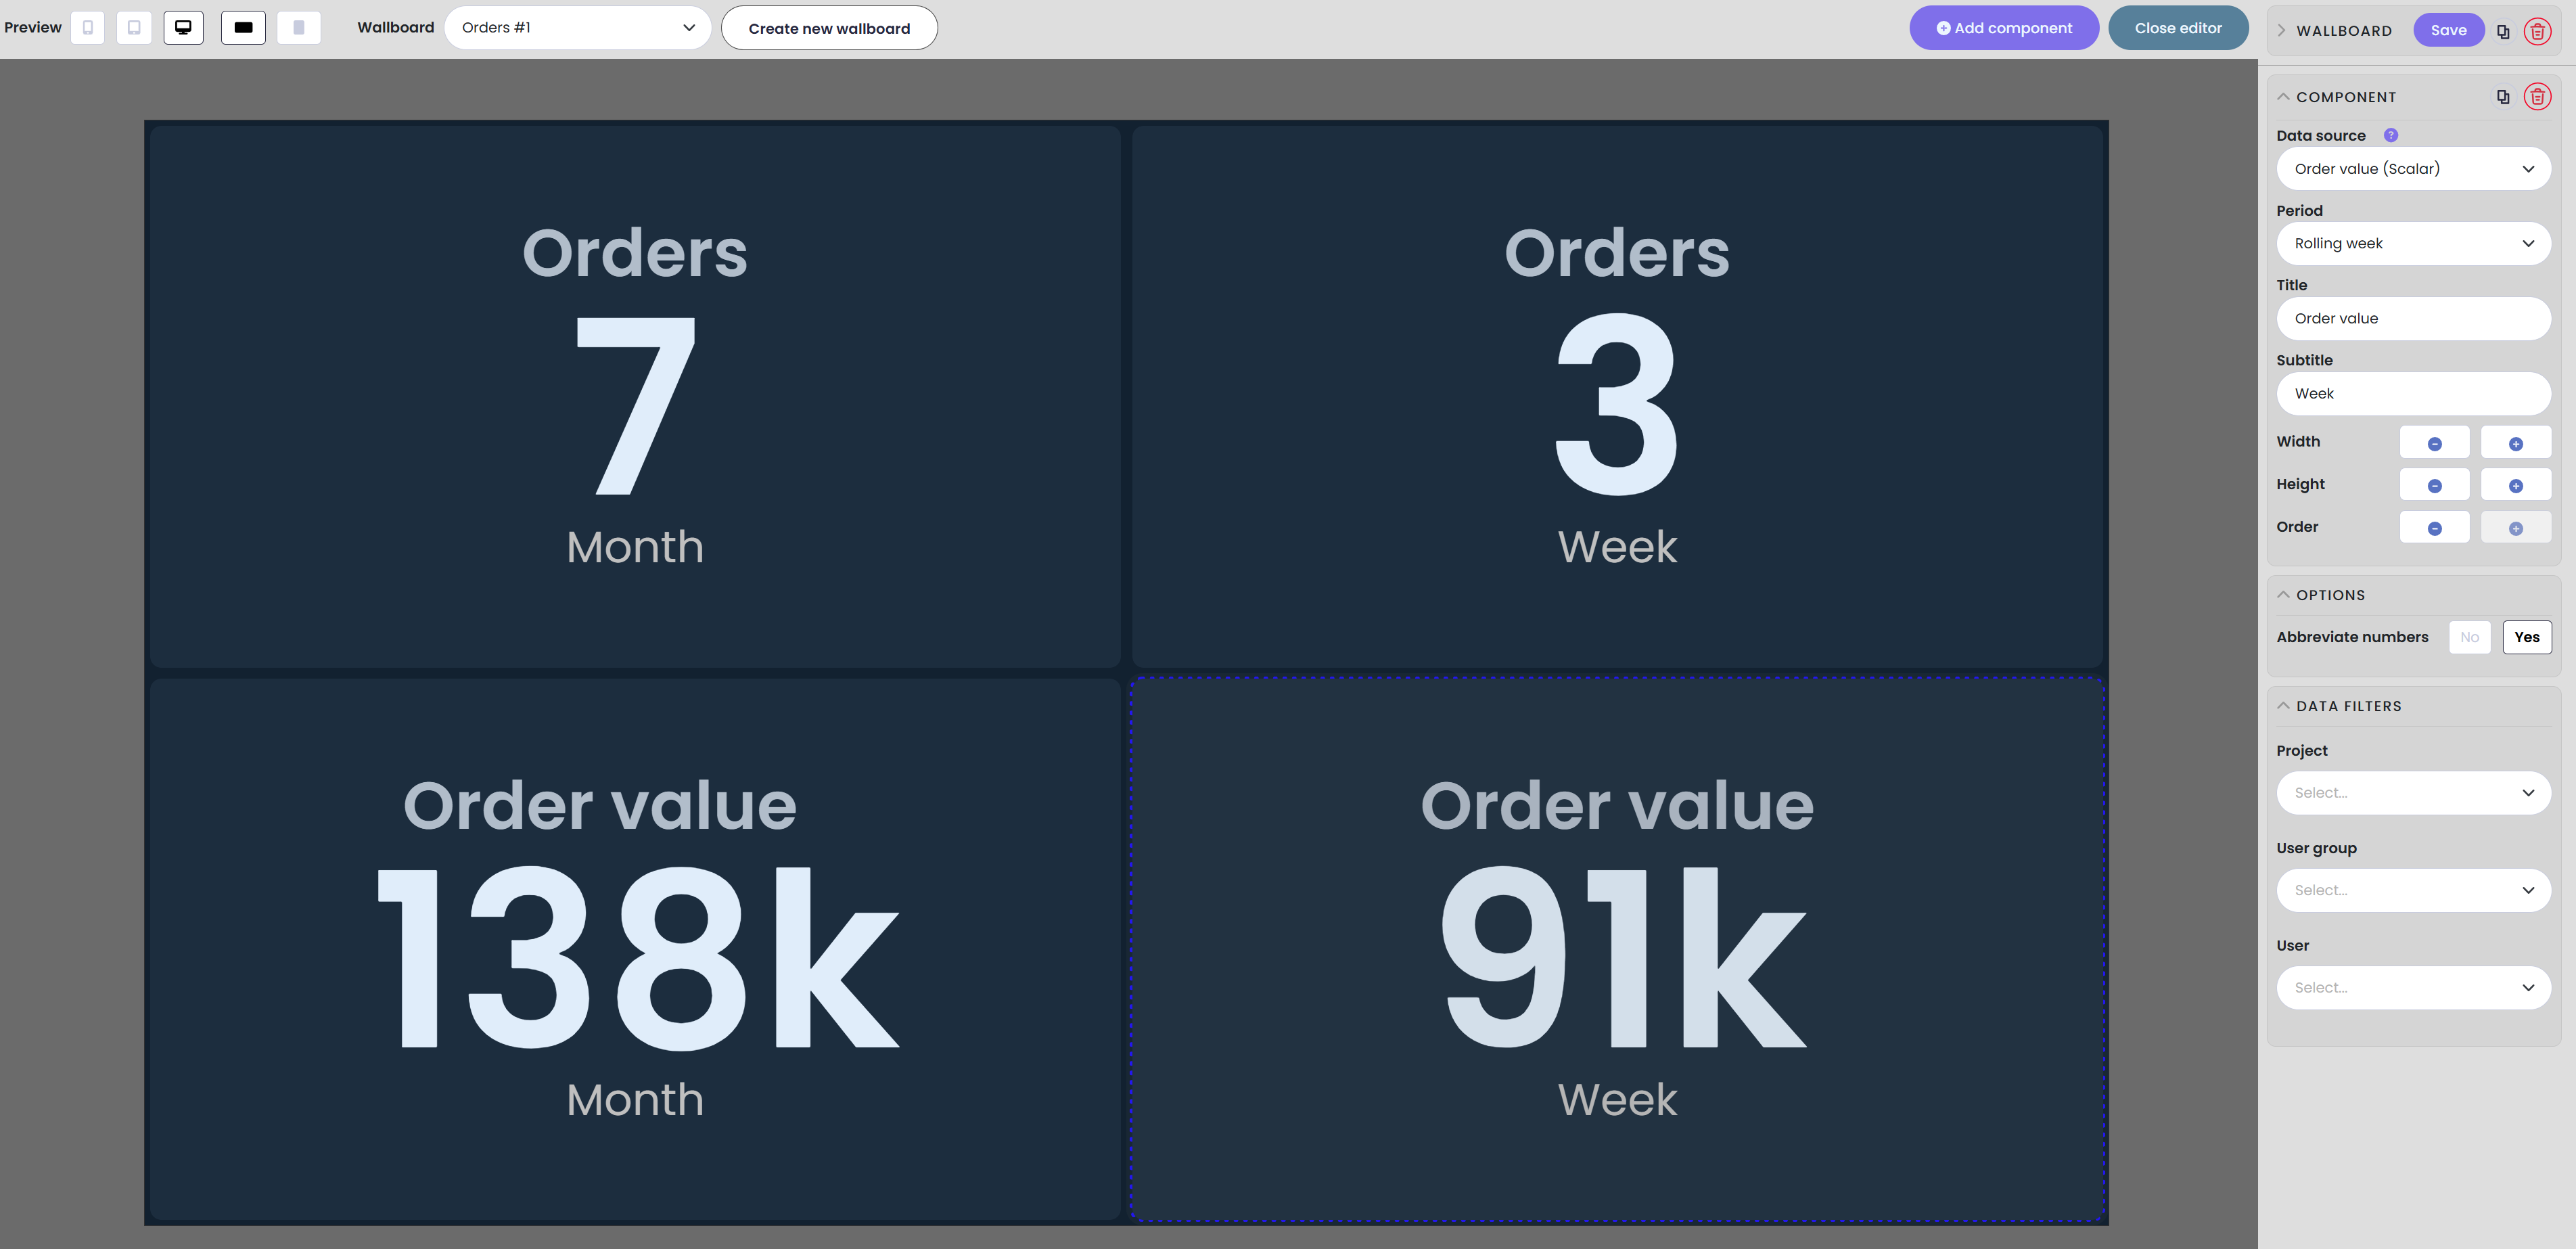
- Click 'Add component' to add a new component, choosing from lists, charts, and scalars.
- Most components include a description.
- A dedicated component type is available for sales competitions, which can be added alongside any list or KPI.
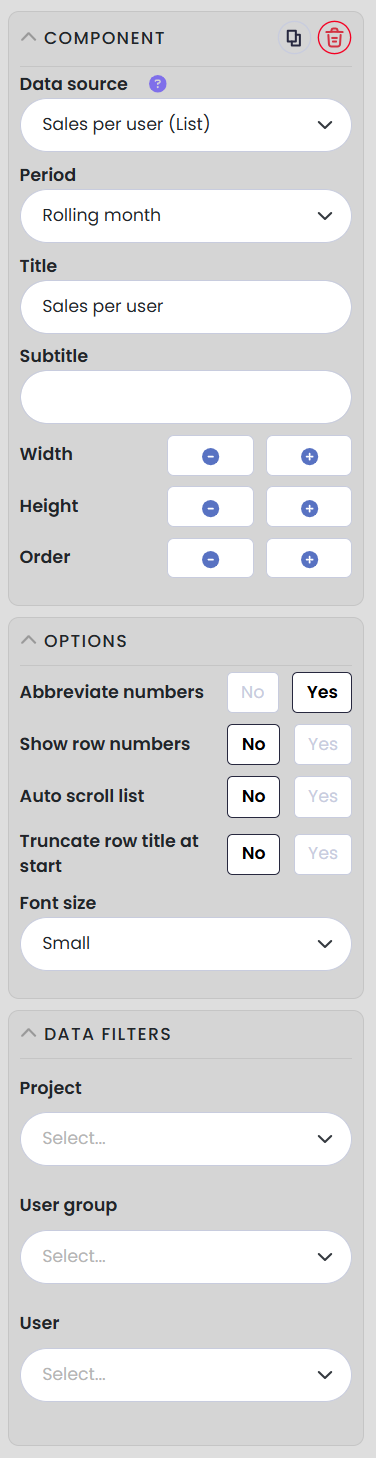
- To edit existing component, simply click on it:
- Set the data source and choose a period.
- Add a title and, optionally, a subtitle.
- Adjust size and arrange the order of your components.
- Abbreviate numbers (e.g., 138,000 is displayed as 138k).
- Data filters
- Projects, and if applicable, buckets
- User groups
- Users
- For list components, there are additional options available:
- Show row numbers
- Enable smart truncation for long names
- Enable smart vertical scrolling for long lists
- Set font size