Statistics
Please note, this documentation is referring to functionality for which an End of Life has been announced. The announcement can be found here, and the new product documentation is available here.
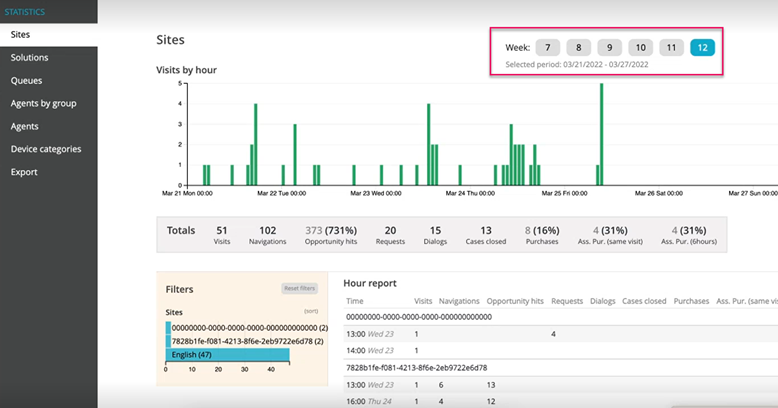
The statistical views depict several aspects of the performance and load. Filters can be used to focus on specific aspects of the statistical data. Furthermore, you can analyse the data for a week, by simply selecting the relevant week number at the top of your screen.
Some of the key statistical features to highlight are as follows:
- Track SLA (service level) for time frame 30 sec, 1 minute and 2 minutes
- Record assisted purchase during the same visit and up to 6 hours. These metrics are presented both in the Site overview, per agent and per device
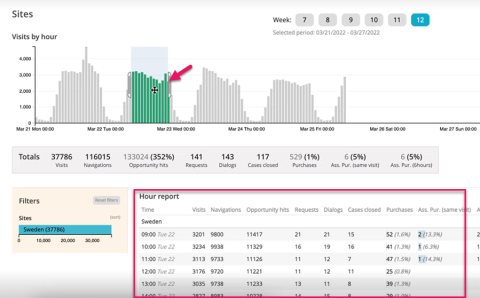
Ability to zoom down to an hour. To reset, just click outside of the selected time period. You can note that both aggregated table and the columns in the report below the graph correspond to the selected time frame
- Bar colour formatting for greater visual appeal
- Tooltip providing a short description about each of the metrics when hovered
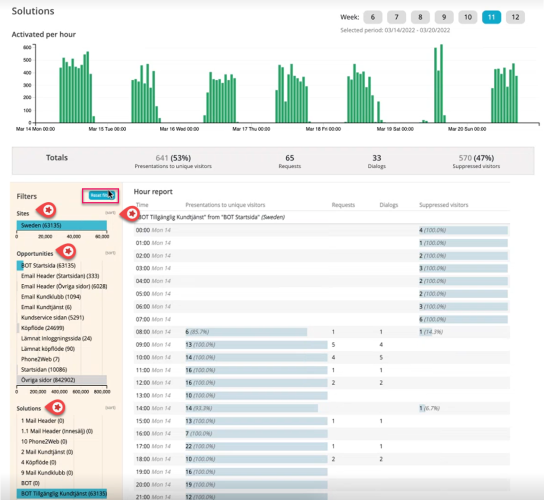
Filters that help analyse each of the opportunities and solutions for all sites and their success rate. You can reset the filter by clicking on Reset filters option to analyse another possibility. To view the highest value on top, just press Sort as shown in the image below.
- Aggregate table or the summary bar that gives a quick view for the entire week or for the current filter selected.
- Ability to download predefined statistic reports in CSV format by selecting the date range and selecting the desired report.
There are various statistics views available as listed below, that allow you to look at the data from a specific perspective. Click on individual reports to more in detail.


