
Standard and Custom reports
This article covers standard and custom reports, time selection in reports, report presentation, sorting, download report and more.
The report list
On page Reports you will see a list of all the Standard reports you have access to.
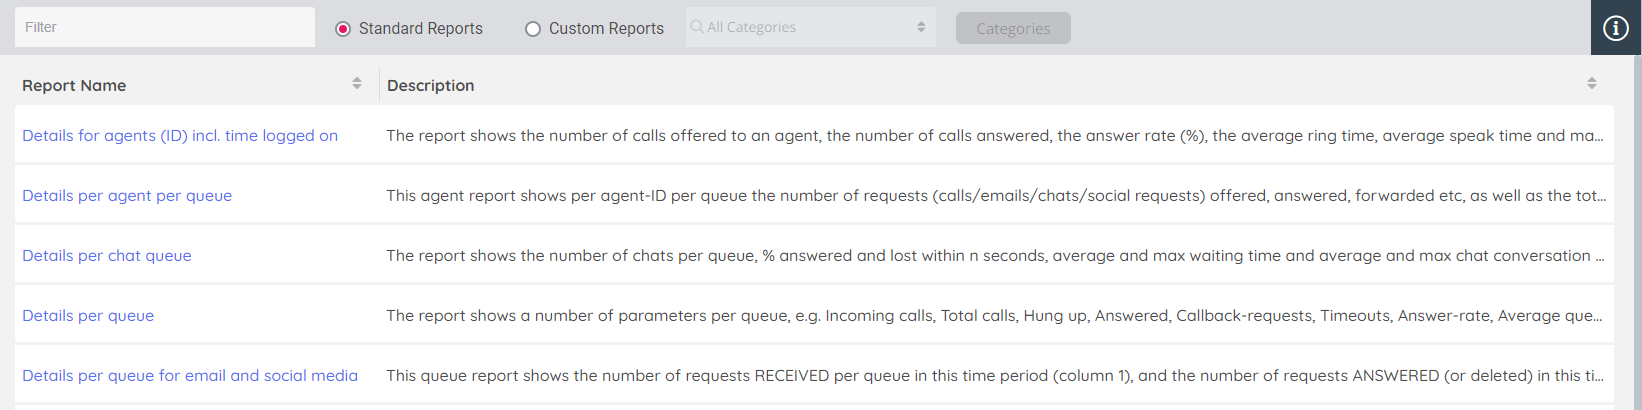
If you tick the radio button ‘Custom Reports’, you will see a list of your company's Custom reports.
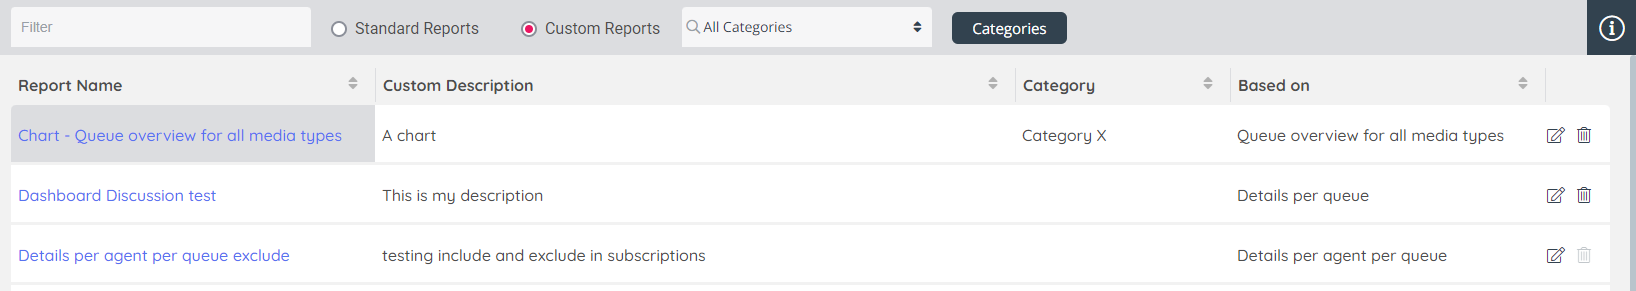
Click the edit icon to update a custom report’s description or change its Category.
Click on the delete icon to delete a custom report. A custom report that’s used in a report subscription can not be deleted.
A Custom report is based on a standard report, but changes have been made to what rows and/or columns to show etc., and this customisation has been saved as a custom report. We recommend all custom reports be put in a relevant a Report Category to get a better overview.
You will have access to all standard and all custom reports in your Puzzel solution unless a resource filter containing selected reports and/or report categories limits what you have access to.
Special reports
If you have access to an old "Special" report, it will appear in the Custom Reports list, with prefix "[Special]".
Please note that Special reports are 'End of Support' from March 2024, and customers are required to rebuild any Special reports still in use via the Raw data solution, before 'End of Life' is announced. If you select a special report, the report's date selector and viewer is shown on the old Reports page.
You can search for a Custom report by typing something in the Filter input box, and for Custom reports you can also select a report category in the list box to only show reports in the selected category.
If you click on a report in the list, the report's Basic information, Report settings and Report parts are shown.
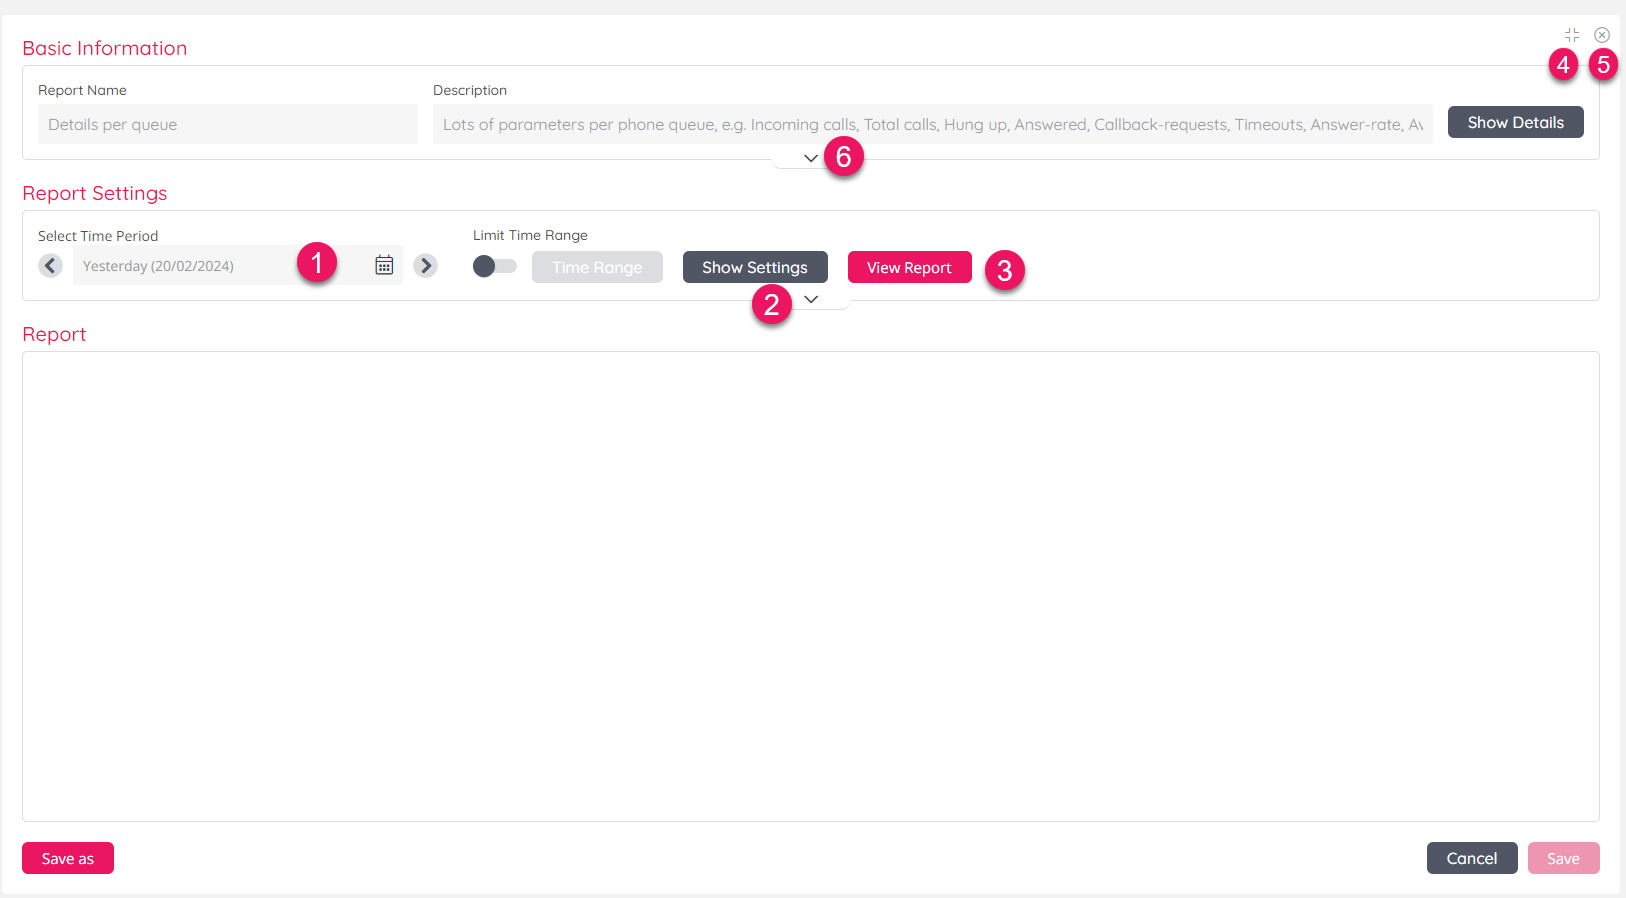
From here you can
- change time period if you want something else than Yesterday
- click arrow down or Show settings to expand the settings part and adjust rows, columns etc
- click View report to generate and see the report
- click the Minimise icon to see the Report list in the left margin while still seeing the details for the selected report
- click the Close icon to go back and only see the Report list
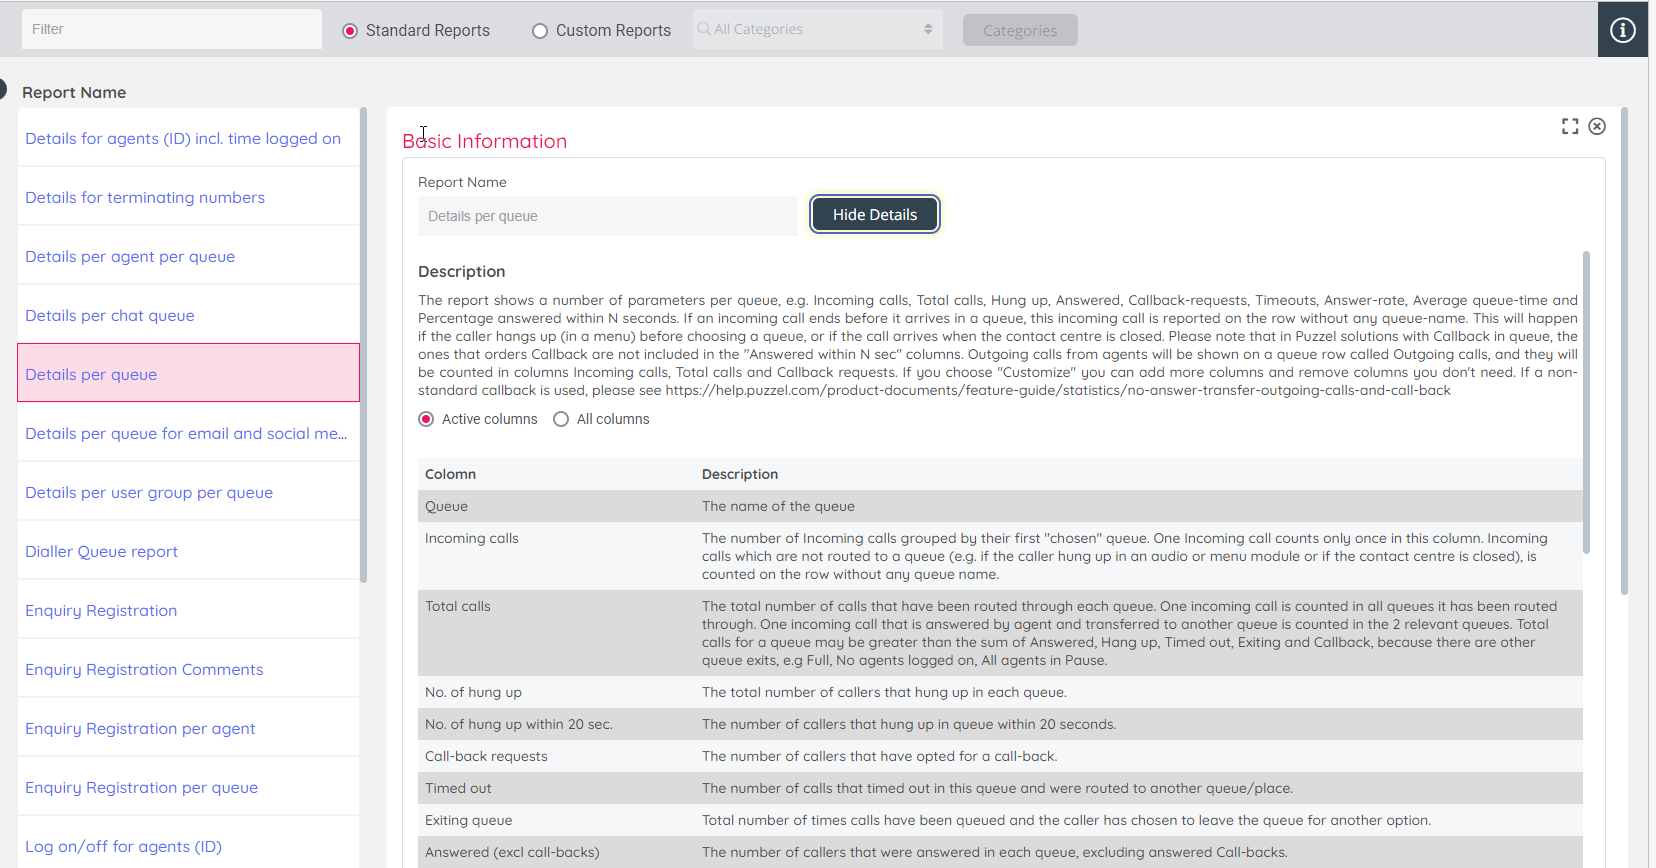
- click arrow down or Show details in the Basic information part to expand and see the full report description and column descriptions
In the Basic information part when it's expanded, only the Active (shown) columns are listed, but if you tick All columns you will also see descriptions for the available columns not currently shown. Click arrow up (at the bottom of the section) or Hide details to collapse the Basic information part.
Report settings and time selection
In Report settings, you can click arrow down or Show settings to expand and see and possibly edit different settings like rows (agents/queues etc.) to include, columns to include, visual type etc. Click arrow up (at the bottom of the section) or Hide settings to collapse settings details.
If you have more than 1 Service Number, your main Service number should be the default selection, and you can select another Service number when needed. If you have a defined Service Number Group (aka Global service number), it will appear in the Service Number list box.
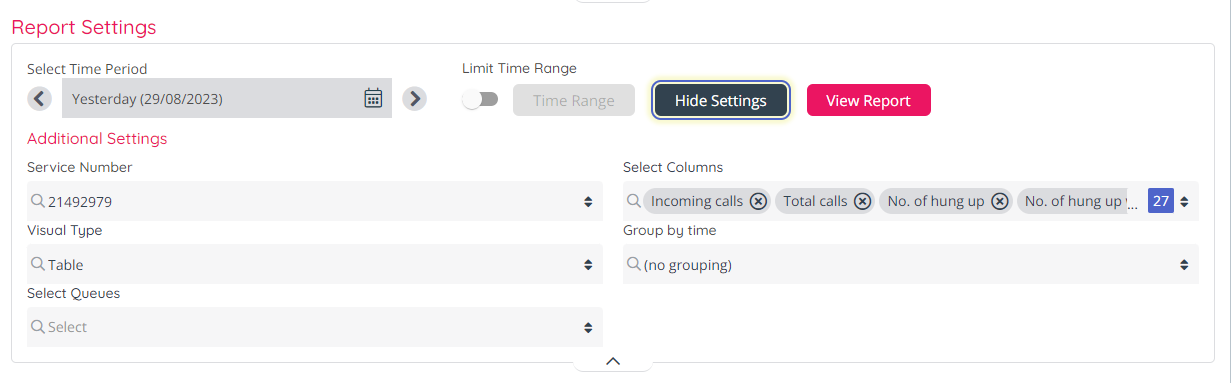
A "Column order" button is shown in the lower right corner of the Settings part only if you have generated a report.
Time selection
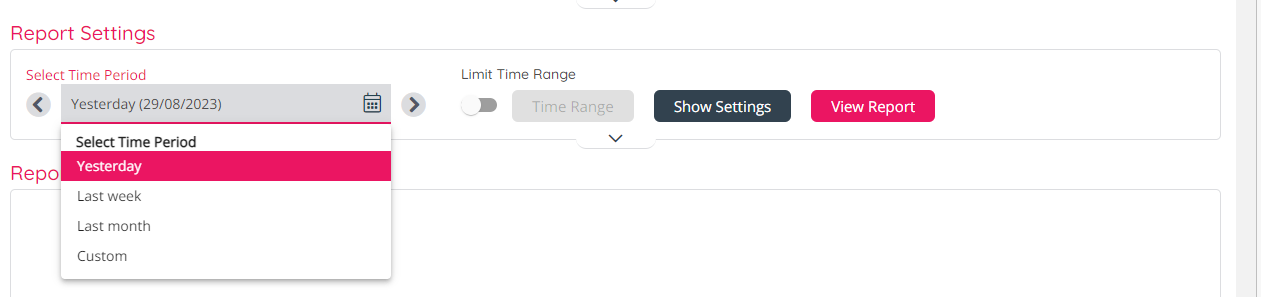
The default selected time period when you select a report is Yesterday. If you want to see the report for Yesterday, simply click View Report.
Click the left arrow to select an earlier day, or the right arrow to select the next day.
Click on the grey field (initially showing Yesterday) to open the list box and change to Last week, Last month or Custom.
If you select Custom, a calendar appears, so that you can select any From and To date.
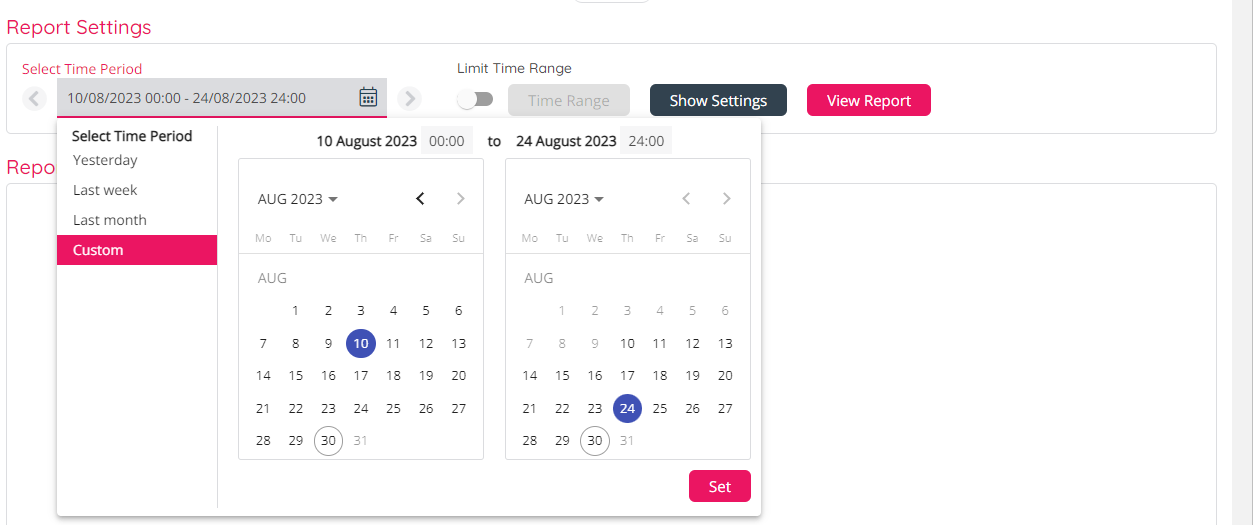
Click on the relevant From date in the left calendar (default for From time is 00:00) and then click on relevant To date in the right calendar (default for To time is 24:00). If needed, adjust the values for hh:mm. After you have selected From and To, click Set and then click View report to generate and show the report.
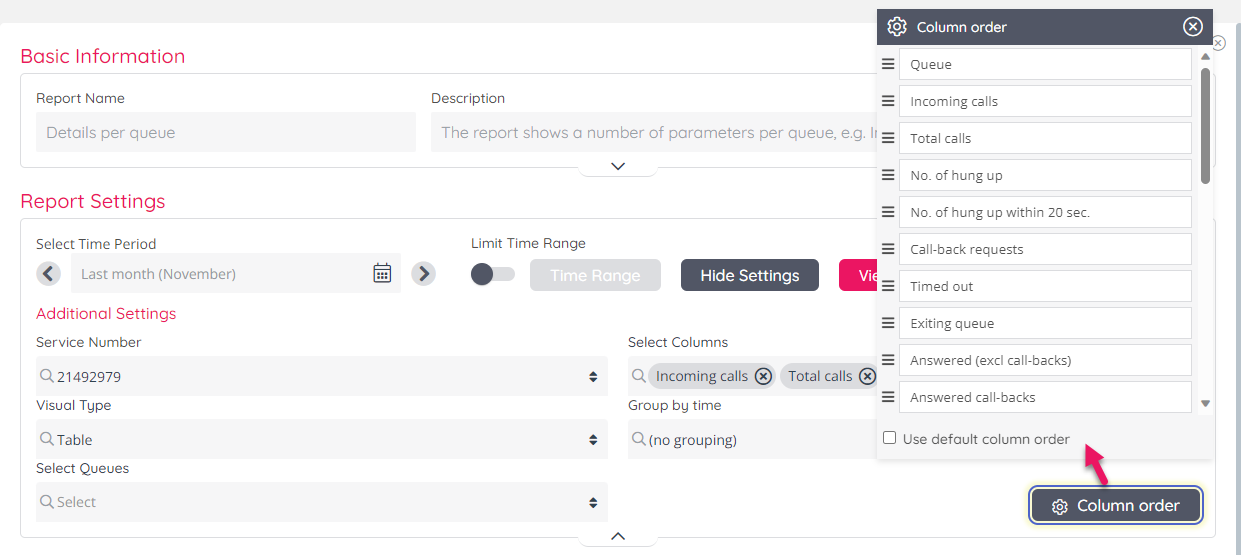
Re-arrange column order
If you expand the Settings part after a report is generated, you will see the Column order button. If you click Column order, a modal opens where you can drag and drop to re-arrange the column order.
When you have clicked View Report, the report is shown like this:
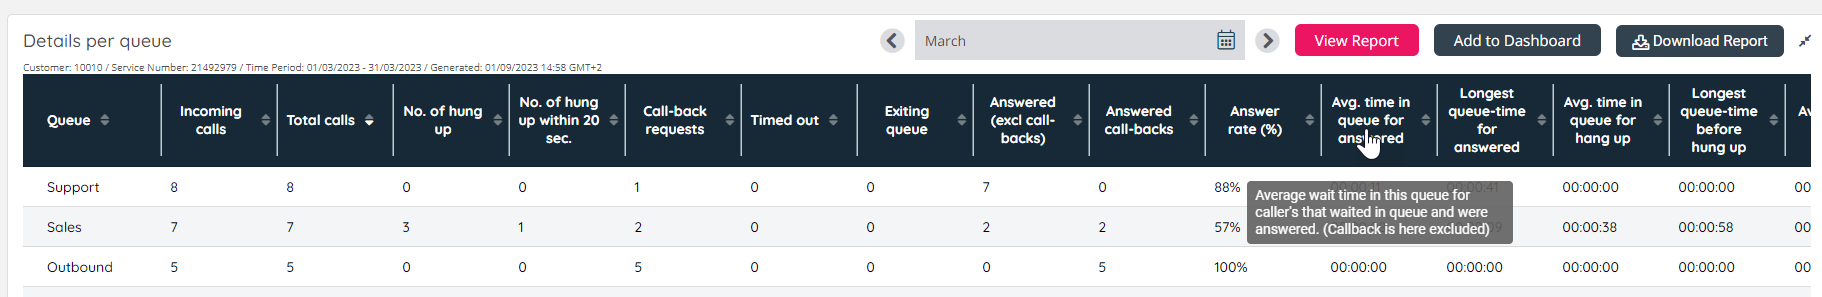
Click on any column header to sort the table based on the values in this column. This is very useful if you like to see e.g. the agents with the most calls or longest put on hold, or the queues with longest wait time or most hang-ups.
If you hover the mouse over a column header, the column description is shown as a tool tip.
From this Full screen mode you can:
- change time period and click View report
- add this report to a Dashboard
- download the report as a csv/xlsx file
- press the ESC key or click Exit full screen (the arrows in the upper right corner) to show the Basic information and Report settings part
If you Exit Full screen mode it looks like this:
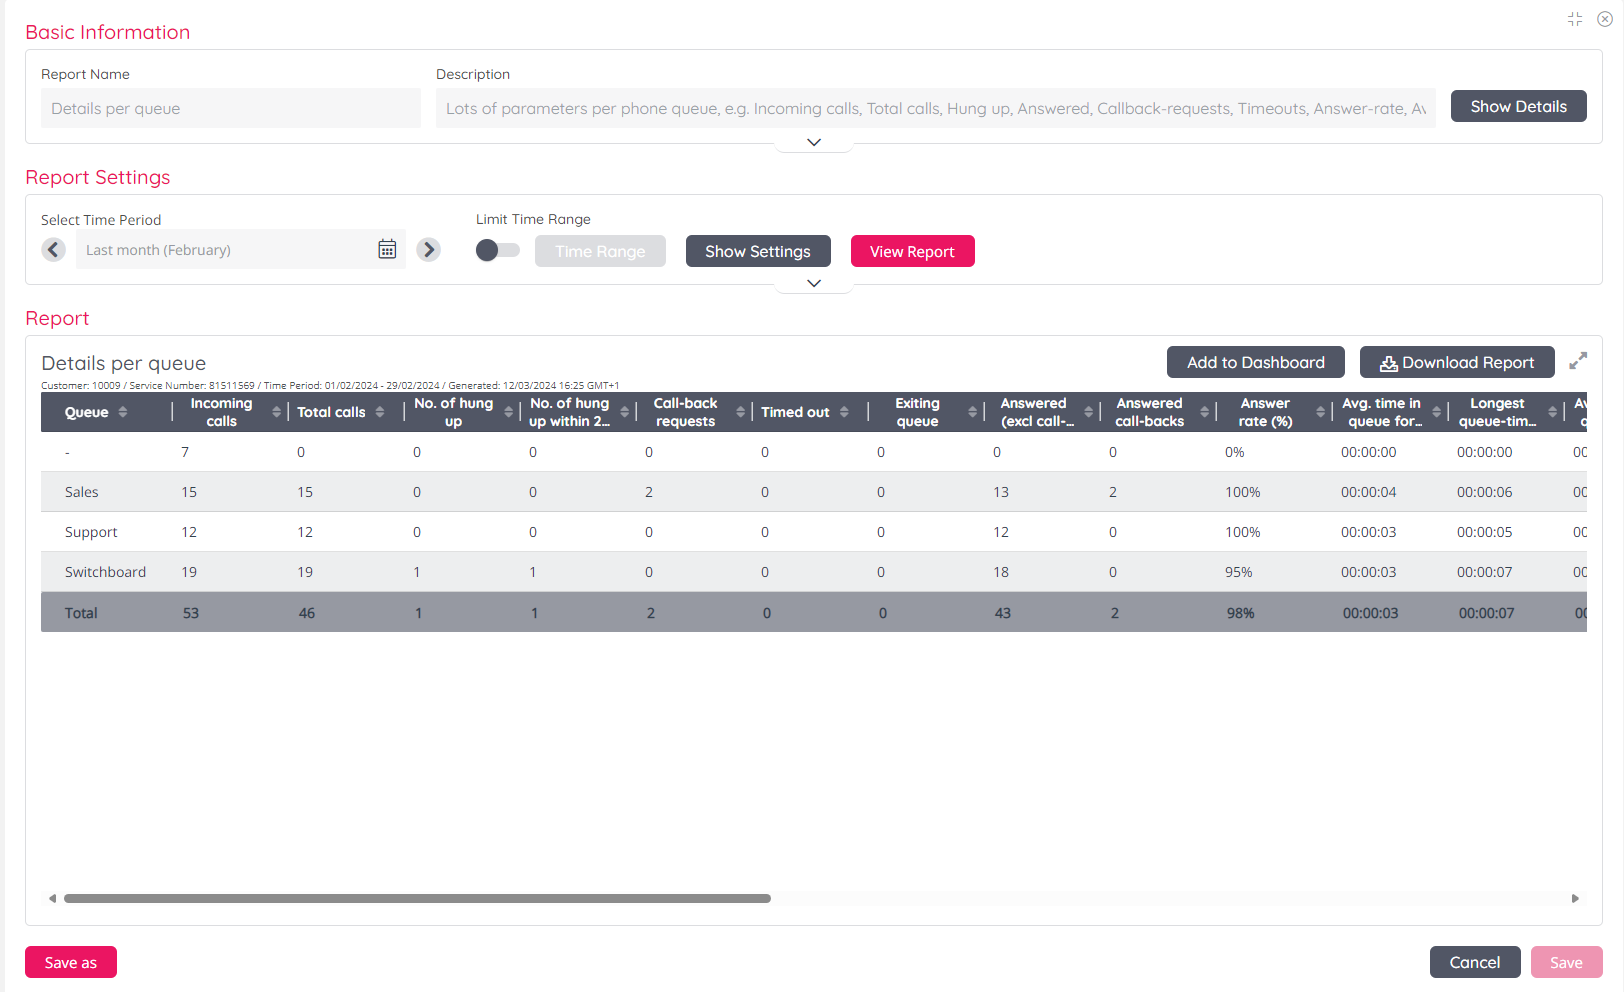
From here you can:
- click the Full screen icon (next to Download report) to maximise the report presentation
- change time period and click View report
- click Show settings to customise columns/rows included, re-arrange column order etc.
- add this report to a Dashboard
- download the report as a csv/xlsx file
- click Save as if you want to save this as a new custom report
- click Save if this is an existing custom report you want to update with the changes done
Download report table as file
When you have generated a report, you can select to download it. When you click Download report, the report's file name will be the "system name" for the report (e.g. QDetails) unless you change it, and the file type will be xlsx unless you change it to CSV.
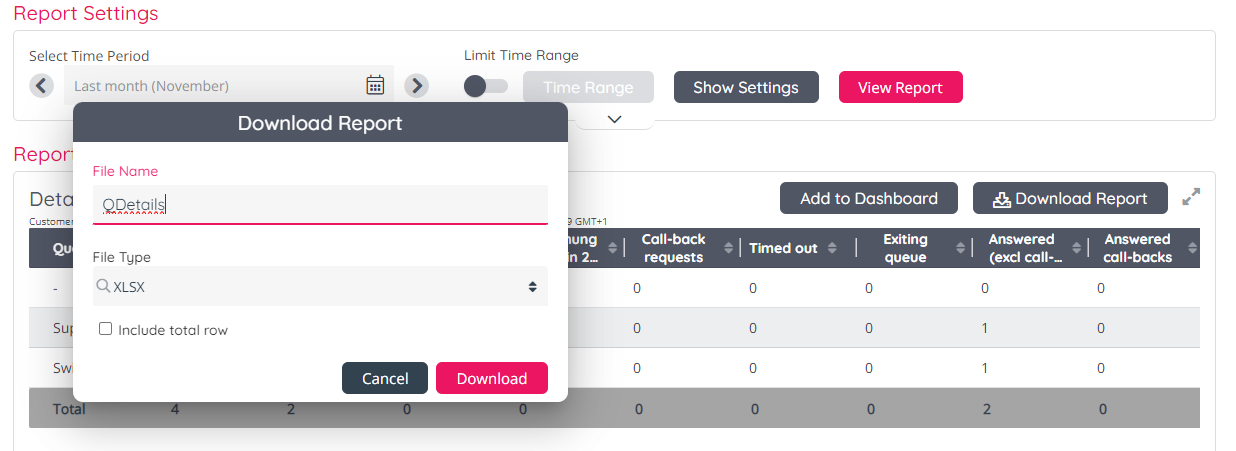
If you want to include Total row(s) in the downloaded xlsx file, please tick Include total row.
A downloaded XLSX file will have the report data in the first sheet, and this sheet will have the Report's name, e.g. Details per queue. The Report parameters (customer number, service number, time period and generated time) will be shown in a separate sheet.
A downloaded CSV file will have the Report parameters (customer number, service number, time period and generated time) on row 1, the column headers on row 3 and data on rows 4-N, and not Total row.