
Customise Reports
This article explains how to customise a report
- Save a new or update a custom report
- Customise rows to include
- Customise columns to include and column order
- Limit time range
- Group by time
- Visual type (table and charts)
When you have selected a report from the report list, you can change different things like Columns and Rows to include and Visual type in the Report settings part.
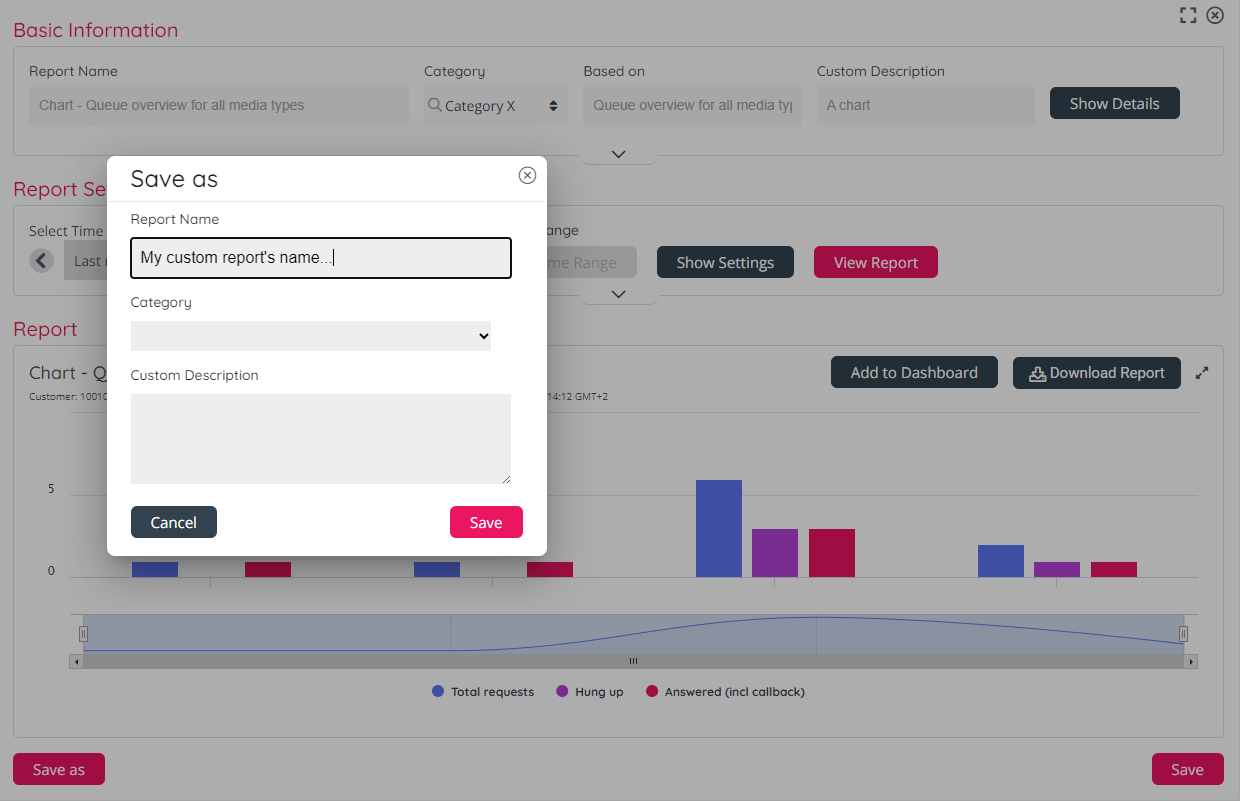
When you have done the needed adjustments in a standard report and you want to save it as a Custom report, click Save as. In the pop-up window, please enter a descriptive name, put it in a Report category and add a custom description. In the custom report list we will show which standard report each custom report is based on.
If you want to update an existing custom report, open this custom report and do the needed changes, and then click Save. If you want to update an existing custom report’s custom description or change its category, click the Edit icon for this report on the Custom report list.
You can also do adjustments in an existing custom report and select Save as to save it as a new custom report, without changing the existing custom report.
Customise Columns
To adjust what columns to include in the report, click anywhere in the Select Columns field (1) to expand it. Don’t click the ‘x’ on an item unless you want to remove the column.
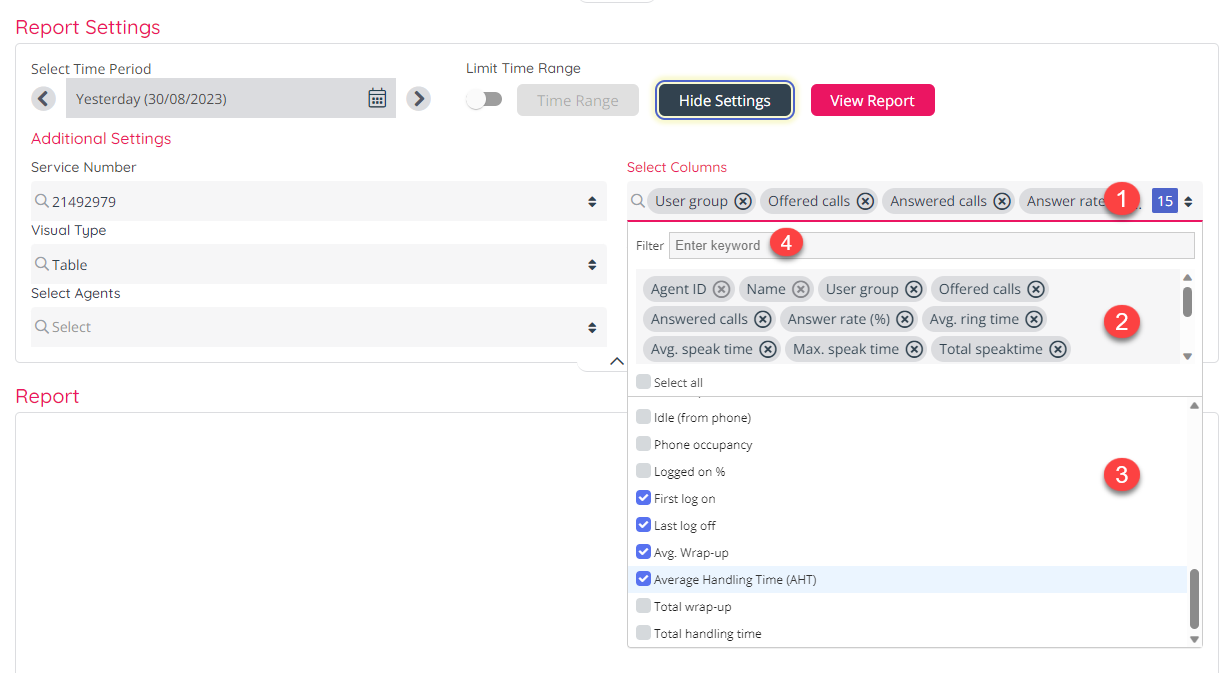
Now you can see parts 2 and 3 of the column selector as well. To remove a column, click ‘x’ at the end of the column name in part 2, or untick the column in part 3. If you want to add a column, tick it in part 3. If the list of available columns in part 3 is very long, you can type a column name in the Filter input box (4) to find it.
Adjust column order
All reports have a default column order for the columns you include. If you want to change the column order, click on the Column order button in the lower right corner of the Setting spart. If you click Column order, a modal opens where you can drag and drop to re-arrange the column order.
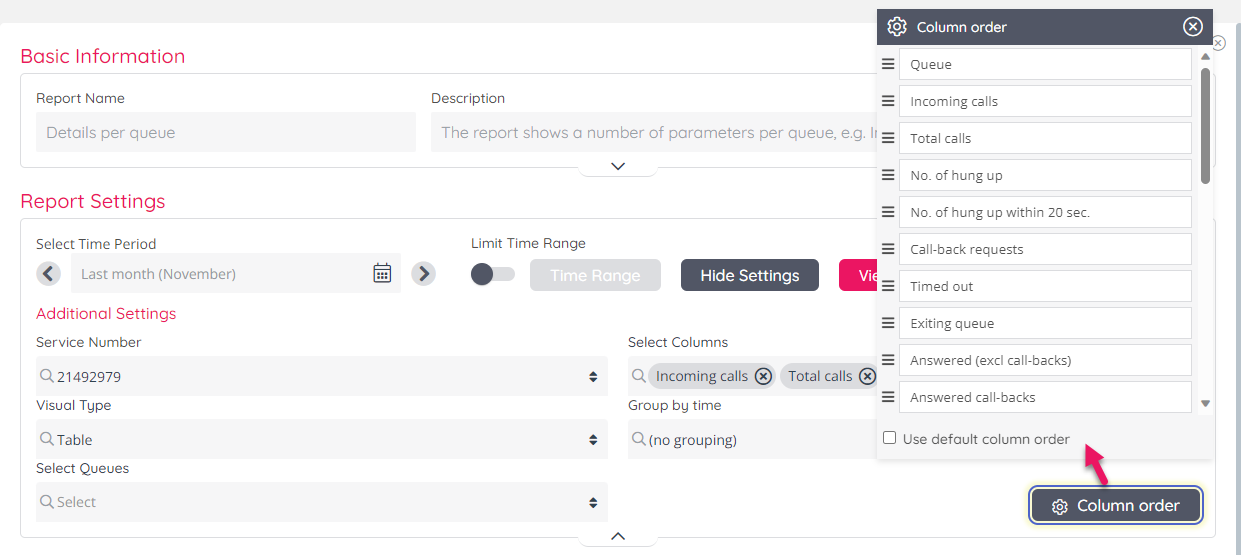
Please note that the Column order button is only shown after you have generated a report.
Customise Rows
The rows in a report are usually queues or agents, but it can be Access numbers, Enquiry registration categories etc. depending on the selected report.
By default in a report, no columns are selected in the configuration, but all columns are included in the report. If the user that generates a report has a resource filter assigned that includes some queues/agents, only those rows will be shown.
If you want to select specific rows to be included in a report, click in the Select queues/Select agents field (1) under Report setting to open the ‘rows selector’.
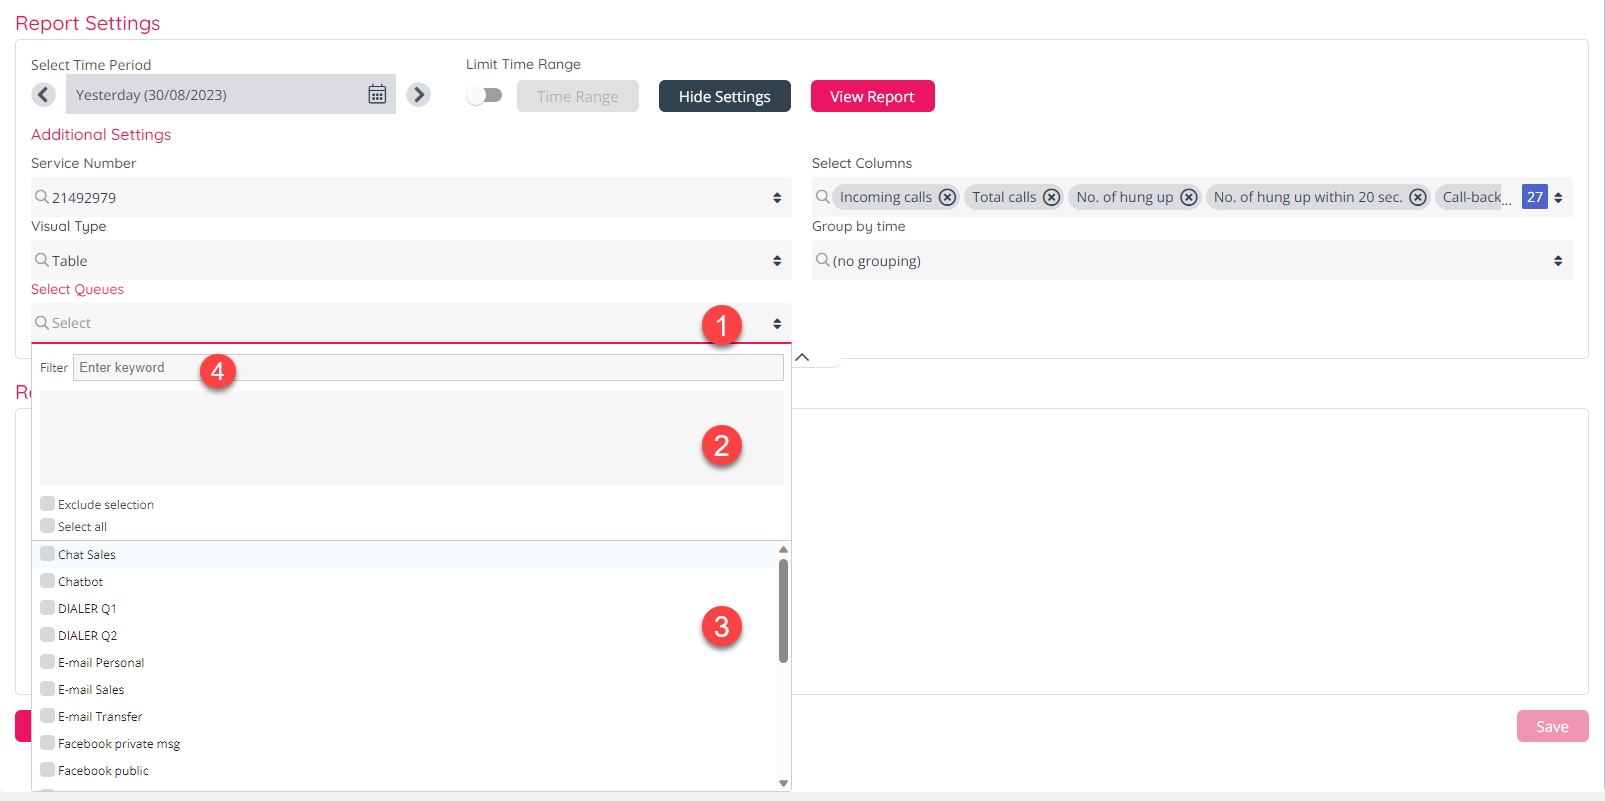
When the rows selector is opened, you can add rows that should be included by selecting them in part 3, and when done, they will appear in part 1 and 2. You can remove a selected row by unticking it in part 3 or click ‘x’ in part 2.
At the bottom of part 2 you will see “Exclude selection” and “Select all”. If you have written something in the Filter, Select all will change to Select all filtered.
There is really no need to select all rows (queues or agents) and save. If you want to see all rows in the report, you should not select any rows. The reason is that if you add a new queue or a new agent, this new queue/agent row will not be included in the report unless it’s specified in this configuration, or unless you have not specified any rows!
If you want to include all rows except a few, please tick Exclude selection and select the few you want to exclude.
Limit time range
If you report is for several days or weeks, you can select to include only parts of the different weekdays (e.g. only 1100-1200 or the opening hours) in the report. Tick Limit time range and then click on the Time range button to define intervals per weekday to include.
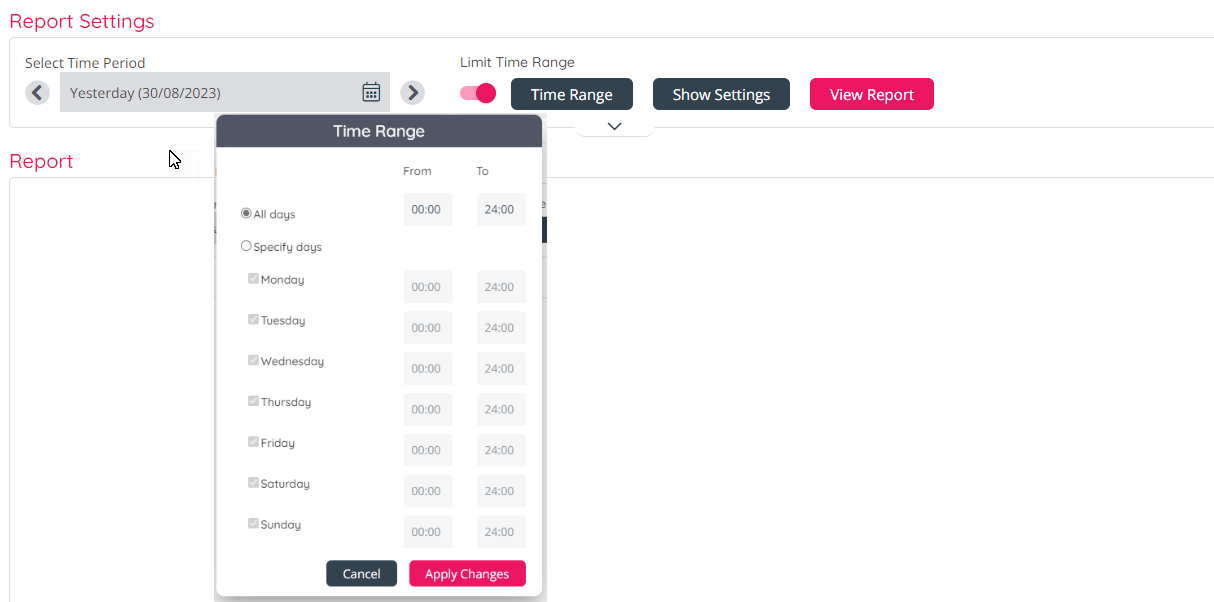
If you do this, please note the main rule in PCC historical reports is that a call (or chat/email) belongs to the time period where the call ended, which means that a call arriving in the IVR e.g. at 16:58 and ending 17:21 (after some time in queue and agent speak time) is reported in the time interval 17:15-1730!
Since calls arriving outside your opening hours will not be sent to queues or agents, it’s not vey useful to limit time range for queue and agent reports.
If you limit time range for Details per queue, you will not see callers that called you when you were closed!
If you want to generate a monthly or weekly report for the night shift, you can do this by entering e.g. From 23:00 and To 07:00. If the From time (e.g. 23:00) is later than the To time (e.g. 0700), this is interpreted as if the To time is the next day.
Group by time
Some reports have a Group by time option, e.g. Details per queue. This might be useful if you generated a report for a day and you want to study the numbers per hour, or if you want to group by Day for a monthly report.
Visual type – chart options
The default visual type is table, but you can select Chart types Bar, Line or Area if you have selected max 4 columns. To improve the readability of a chart, we recommend select 1 or a few rows (e.g. queues).
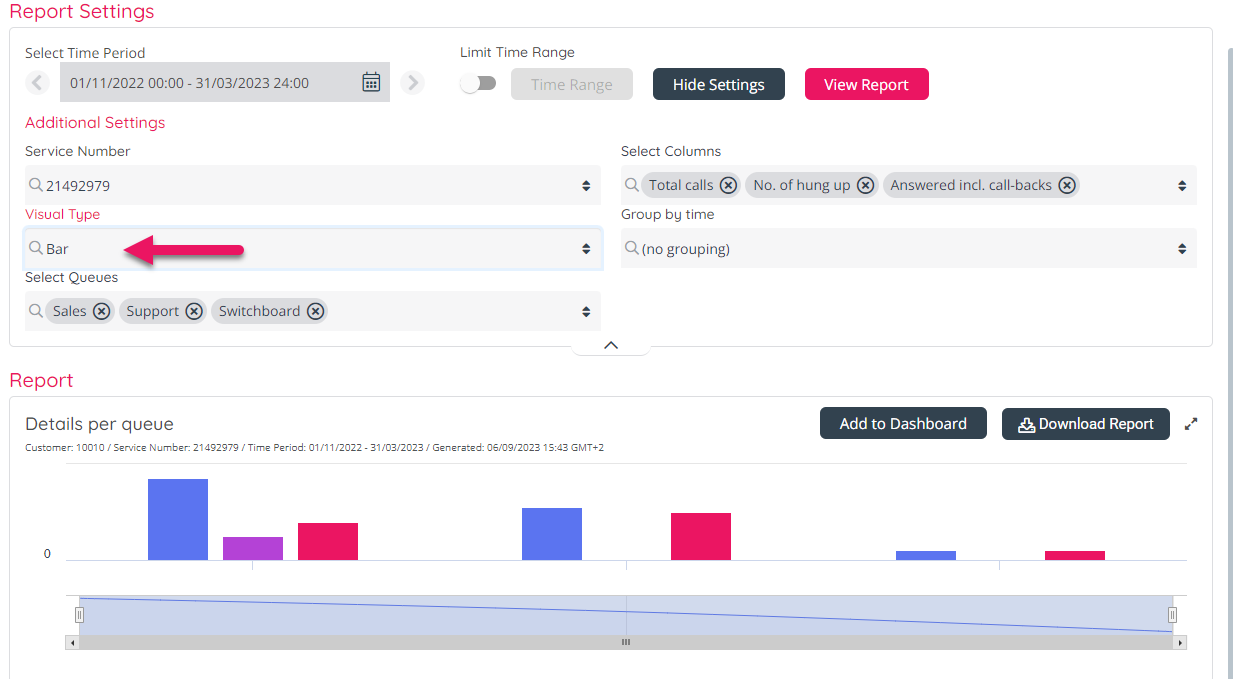
You can download a generated chart to file (pdf, png, jpg or svg), or select Add to Dashboard.
Please note that if you save a chart as a custom report and then include this custom report in a Report subscription, the email sent with the report will not contain a file with a chart, but a table with the data.