
Editing Forecasts
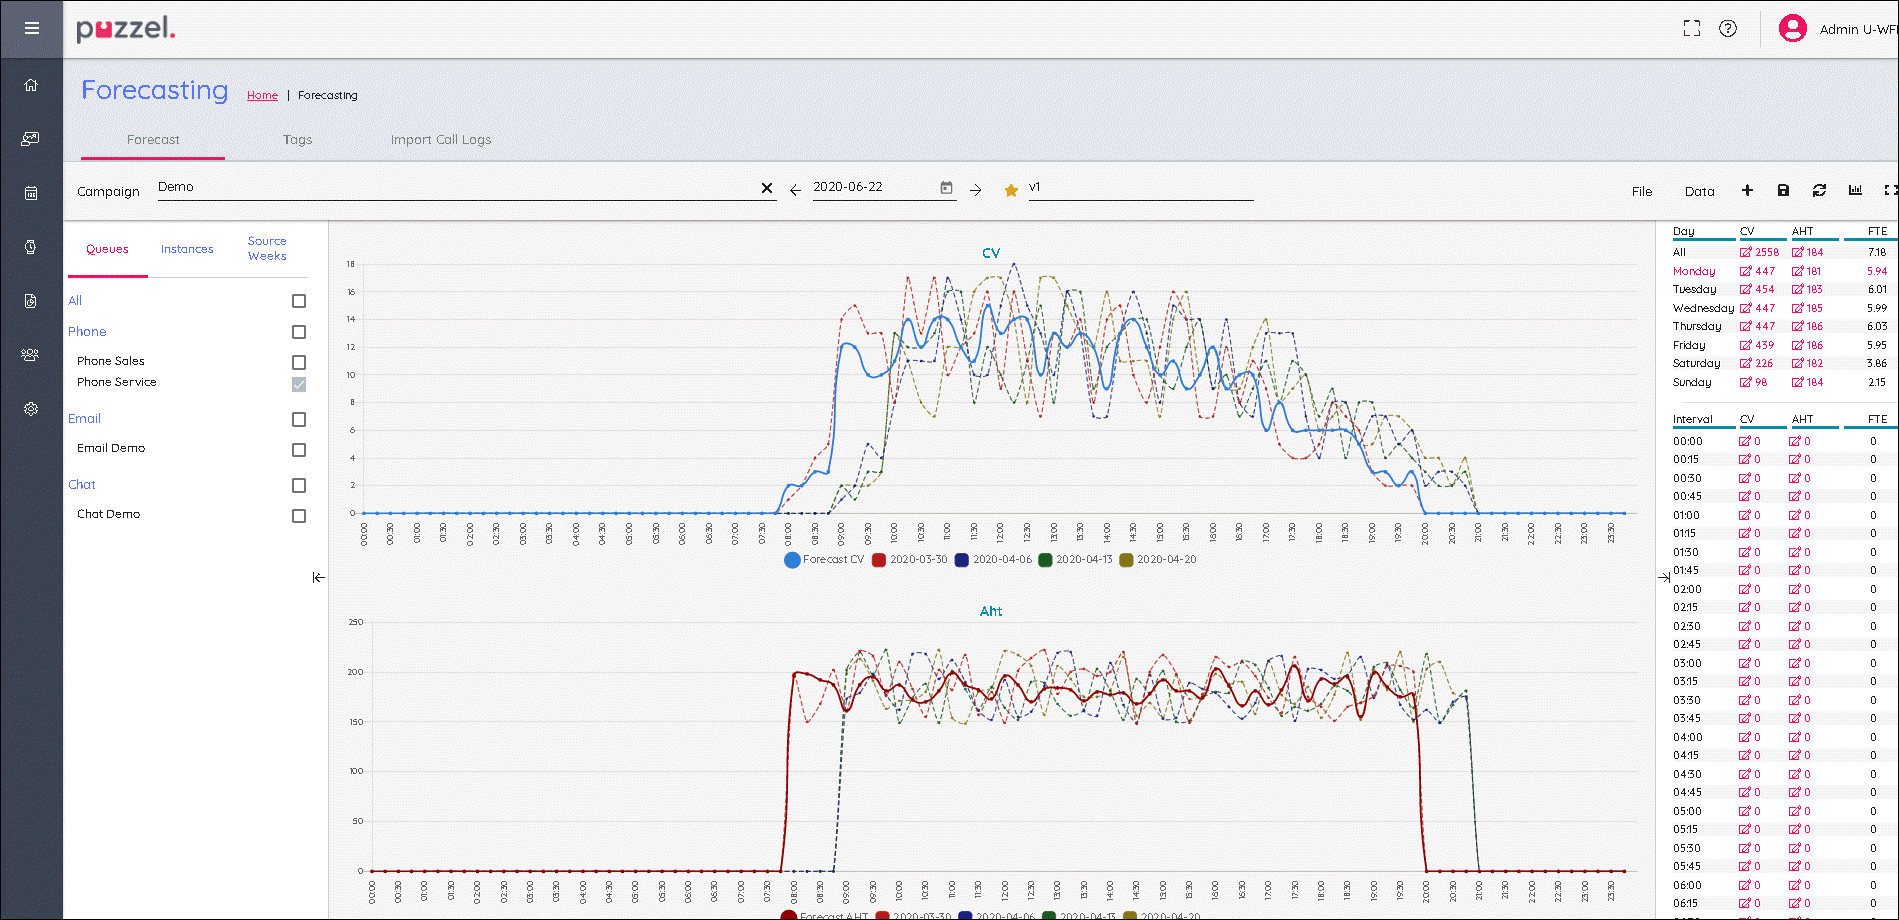
- The graphs are split by Contact Volume (top) and AHT (bottom)
- Forecast Contact Volume is the solid blue line
- Forecast AHT is the solid red line
- Multi coloured dotted lines show the historical data used to build the forecast
- Drag and drop either forecast line to modify the forecast for the selected day
- To change the day, click on the day at the top right of screen
- Choosing All at the top right of screen shows aggregated data for each day, the daily data can also be dragged.
- Clicking on Edit icons in either the Day or Interval view allows you to scale the forecast. Any new values will distribute over the forecast model relative to the original values.
- Changes to the forecast will automatically update the FTE Requirements
- If there are more than one queue, the FTE Requirements will show a lower and upper number. Lower number = all agents can answer all contacts, Higher Number = requirements of each queue added together.