Viewing a Forecast
Main Screen Overview
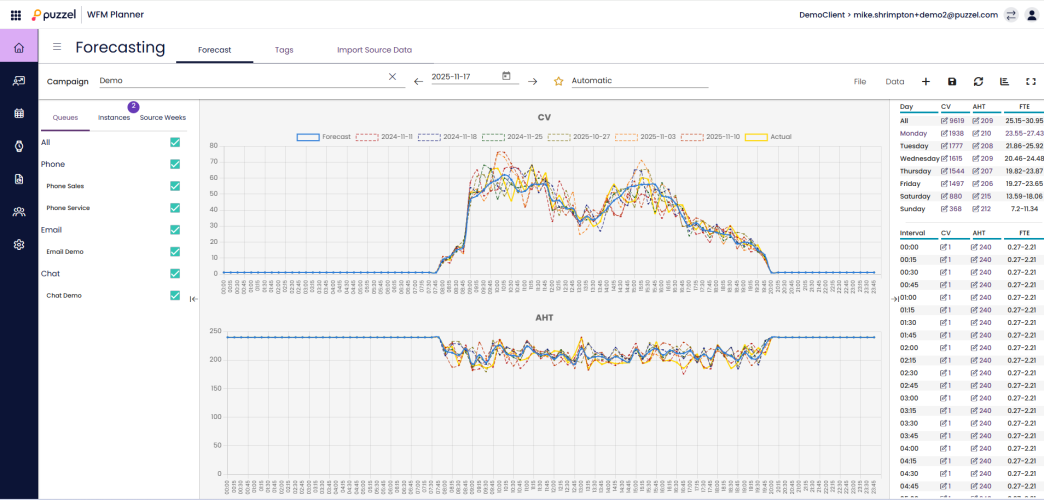
After using the wizard to create a forecast, or if loading an existing forecast, a screen similar to below will appear.
There are 3 main windows on the screen.
To the left, a section for Queues, Instances and Source Weeks can be seen. In the middle, are the associated graphs where the forecast for both Contact Volume, AHT and all of the historical data used to build the forecast can be seen.
To the right, Weekly, Daily and Interval Contact Volume and FTE Requirements can be seen.
Queues, Instances and Source Weeks
Clicking on each of the tabs shows different information:
- Queues – All queues are listed and by default are selected. Queues can be deselected or re-selected by checking the boxes for either the queue name or the media type.
- Instances – Shows a list of all the forecast instances for the week.
- Selecting a forecast will show the details of that instance on the Queues & Source Weeks tabs.
- Marking a forecast instance as ‘active’ means that it will be used for scheduling & statistics calculations on the scheduling day page.
- Source Weeks – Shows summary data for each of the source weeks that were used to build the forecast.
Main Forecast Screen
Across the top of the screen is the menu options for the forecasting screen.
To the left is the name of the instance, in the above example it is called ‘v1’. The yellow star next to the name signifies that it is the ACTIVE instance.
To the right are various tabs or buttons.
File > Create Forecast - Create a new forecast instance using the wizard
File > Auto Forecast - Creates a forecast with no further input
File > Export – Exports the selected forecast to a .csv file
File > Export All Instances – Exports all the forecast instances in this week to a .csv file
File > Export Source Weeks – Exports the history data from the source weeks of the selected forecast instance to a .csv file
File > Import - Creates a new forecast instance containing the data from a .csv file. You can Export a forecast, modify the data in another application (eg Excel or notepad) & then import the file as a new forecast
File > Save – Saves changes made to the forecast instance
File > Save As New – Creates a new instance by copying the current instance
File > Make Active – Makes the currently selected instance the Active forecast
File > Delete – Deletes the currently selected instance, if only one instance the forecast will be left empty
Data > Clear – Forecast is changed to 0 for both Contact Volume and AHT all week. Historical data is retained
Data > Copy Forecast – Opens a pop up screen to choose which weeks to copy the forecast to. This will include any changes to the forecast that has been made by the user
Data > Offline Tasks - Not shown if you have no offline task queues in the campaign. Allows you to enter the amount of time you would like the scheduling engine to assign to agents for each offline task queue
Data > Confidence Score - Shows the AI summary of how much confidence you should have in the forecast instance
Data > Accuracy Score - Shows the AI summary of how accurate the forecast was
Icons
+ - Shortcut for adding This Instance or New Instance.
Disk – Saves the forecast.
Restore – Returns the forecast to it’s last saved state.
Graph – Allows switching between Contact Volume/AHT and Required Agents. Toggle Source Weeks will show/hide all source week data on the graphs
Box – Toggles showing just the graphs

