
Historical Report widget
One Dashboard can consist of one or more real-time widgets (Traffic/Queue/Agent) and/or one or more Historical report widgets.
A historical report widget can be added to a Dashboard in 2 different ways:
- On the Dashboard page, select Add widget of type Historical report and select a standard report and then customise rows/columns etc
- From page Statistics - Reports, choose a custom report (and possibly adjust it) and then choose "Add to Dashboard"
Why add a Historical report to a Dashboard?
- If you want to see the same historical reports every morning for Yesterday or every Monday for last week, you can generate these reports manually on page Statistics - Reports every time you need them, or you can create a Report subscription and have these reports sent to you by email as xlsx attachments, OR you can define these reports as historical report widgets in a Dashboard, and take a look at this Dashboard every morning or whenever you want.
- If you want to see the same historical reports every day for so far today, so far this week or so far this month, you can generate these reports manually on the Reports page when needed, or you can define these historical reports as Dashboard
- In the Dashboard widget, select the relevant "relative" time, e.g. From = Today 00:00 / This week - Monday / This month - 1st and To = Today 24:00 / This week - Sunday / This month - last day of month
- About So far today:
- You can study the real-time data for Offered, Answered, Wait time, Speaktime etc so far today shown in Ticker Queues/Agents, on a Queue/Agent Wallboard, or in a Dashboard's real-time Queue/Agent Widget.
- If you create a Historical report Widget showing data so far today, please note the default delay for generating historical reports are 2 hours, which means that reports for e.g. 00:00-14:00 today is available shortly after 16:00!
Aside from a few configuration specificities, the Historical Reports Widget is similar to the real-time widgets that one can configure on a Dashboard and further manipulate its size, location and visual properties.
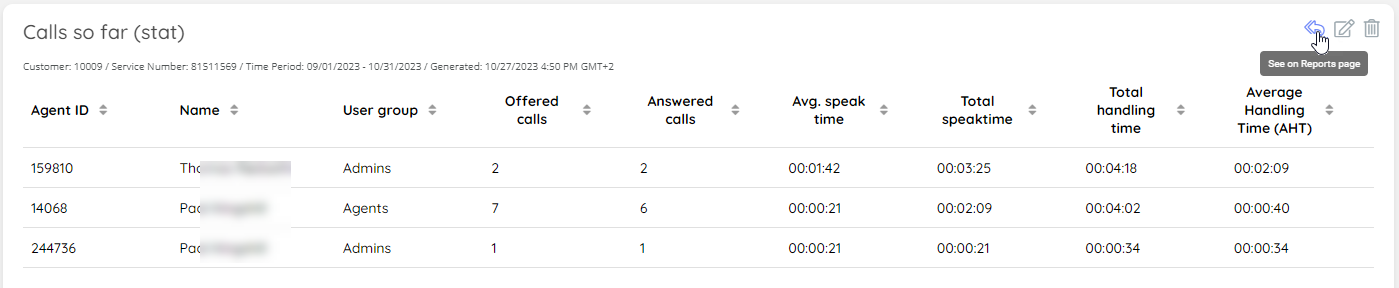
For a Historical Report widget shown on a Dashboard...
- we show which time period the historical report is for and when it was generated
(the line with small text above the table/chart) - we auto-update the report every 15 minute (which is useful for so far today reports)
- you can select "See on Reports page" to be sent to the Reports page with this 'view', so that you easily can run this report for another time period than what is shown on the Dashboard
If you wonder which historical report a specific Widget is based on, you can click the "See on Reports page" icon, or if this Dashboard is yours, you an click the widget's edit icon to see the details in step 2 of the configuration.