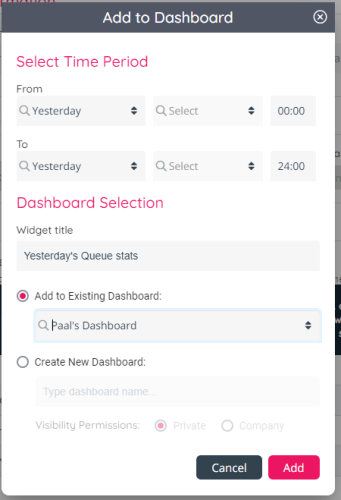
Add Report to Dashboard
If you want to see the same historical report (table or chart) e.g. every morning for e.g. yesterday, you can on the Reports page click Add to Dashboard, select the correct “relative” time period, enter a Widget name and put it in a new or an existing Dashboard. You can put more than 1 report (widget) into the same Dashboard.
When you have added a report to a Dashboard widget, go to the Dashboard page and adjust the widget's size and placement, and do more adjustments (e.g. colors) if you like.
When this is done, you can look at this Dashboard e.g. every morning. This is an alternative to generating the same historical report(s) every morning for yesterday, and an alternative to configuring Report subscriptions so that you get the reports as xlsx attachments per email (every day).
You can also select relative time to be From Today 0000 and To Today 2400 to see statistics so far today, but please note that the historical statistics reports are generated with a delay.

