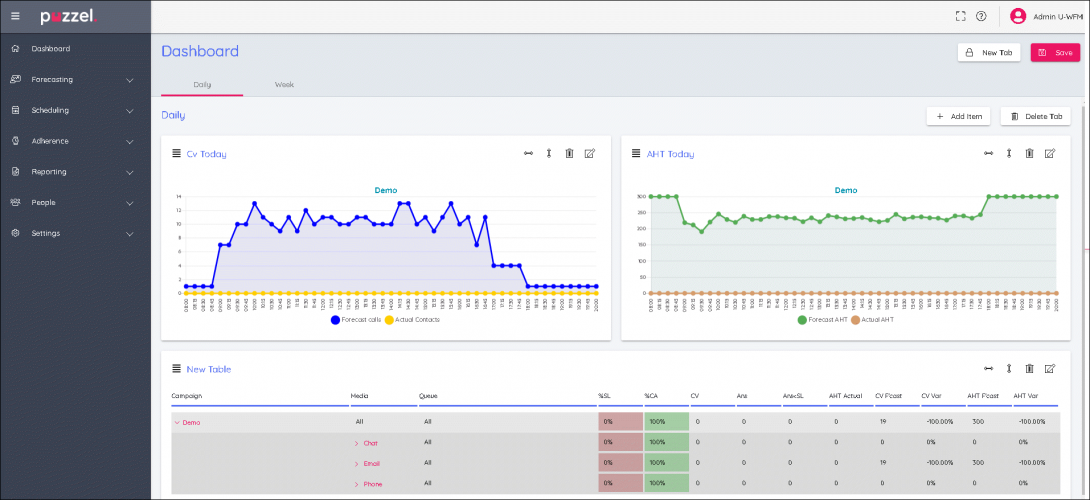
Dashboard
Up to 5 tiles can be saved to a dashboard tab
- It is possible to have 2 dashboard tabs
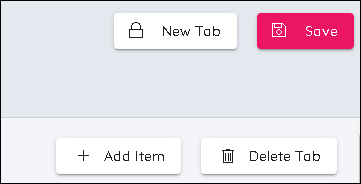
- There are 4 buttons on the upper right of screen. Add Item, Delete Tab, New Tab and Save
- By default, a tab will already exist
- To Add tiles, click on Add Item
- Choose from Add Chart, Add Stats or Add Campaign Summary
- Chart is for detailed information over intervals of time.
- Stats is for a Table and shows statistics over periods of time, Daily, Week to Date, Month to Date
- Campaign Summary shows the status of weeks in the future with regards to forecasts, schedules and published schedules
- Charts and Stats allow the choosing of metrics that are to be displayed. Click the diagonal pointing arrow to choose data
- Tiles can be made taller or shorter, wider or narrower. They can also be dragged and dropped to different positions.
- Click Save to save any changes to the profile.