How to scale a forecast
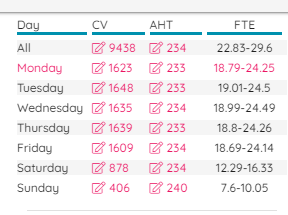
At the right of screen, volumes and Average Handling Times can be seen for the Weekly or Daily figures.
By clicking on the pencil icon, any volume can be altered. Changing the Weekly figures will alter the forecast by Day relative to the original volume.
Changing the Daily volume will simply distribute the volume over the model in the graph.