
Add, Remove and Edit Widgets
A Widget in a Dashboard is a visualisation of a piece of data, in some specific form - for example a label with a specific value, a table of values or a chart that displays one or more series of data.
Add a Widget
You can add one or more Widgets to a Dashboard. Each widget will display a set of data - either a collection (e.g. table or chart), or a single value (e.g. one or more labels).
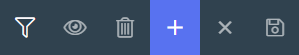
To add a widget to a Dashboard, click the "plus" icon on the top right of the Dashboard page:
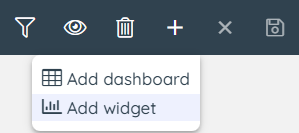
If you want to add a Widget to the active Dashboard, select Add widget in the sub-menu.
(If you want to create a new Dashboard, select Add Dashboard).
Once you have clicked "Add Widget", you need to select a type of widget:
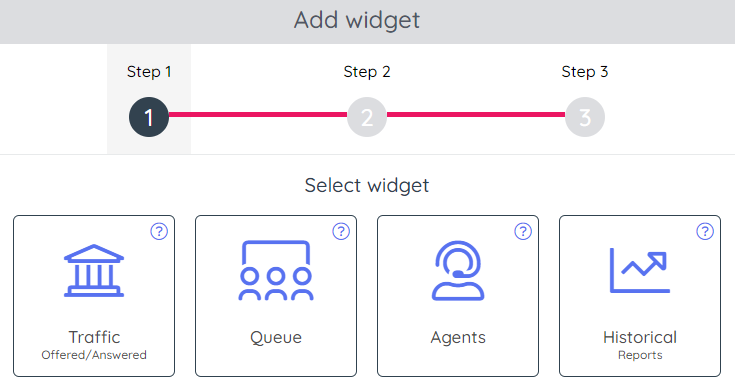
Each widget type is related to the underlying data for it. The different Widget types are:
- Traffic - Offered and answered requests per queue per 15 minute period, so far today (similar to what is shown on the Homepage)
- Queue - Real-time including 'so far today' parameters per queue, such as In queue now, Agents per status now, Answered, Wait time, AHT etc.
- Agents - Real-time including 'so far today' parameters per agent, such as Agent Status, Answered, Speaktime etc.
- Historical reports - Select a standard report and customise columns, visual type etc.
You can also choose Add to Dashboard from the Reports page for both standard and custom reports.
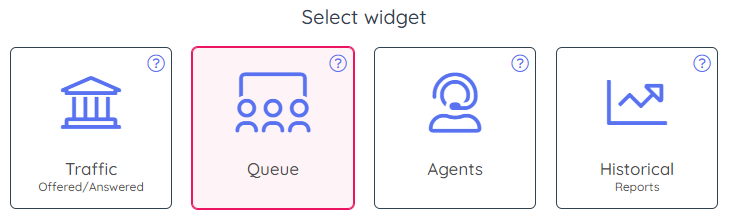
Once a widget is selected, it is marked accordingly:
When a widget type is selected, please click the "Next" button, located at the lower right section of the page:
This takes you to step 2 in the wizard:
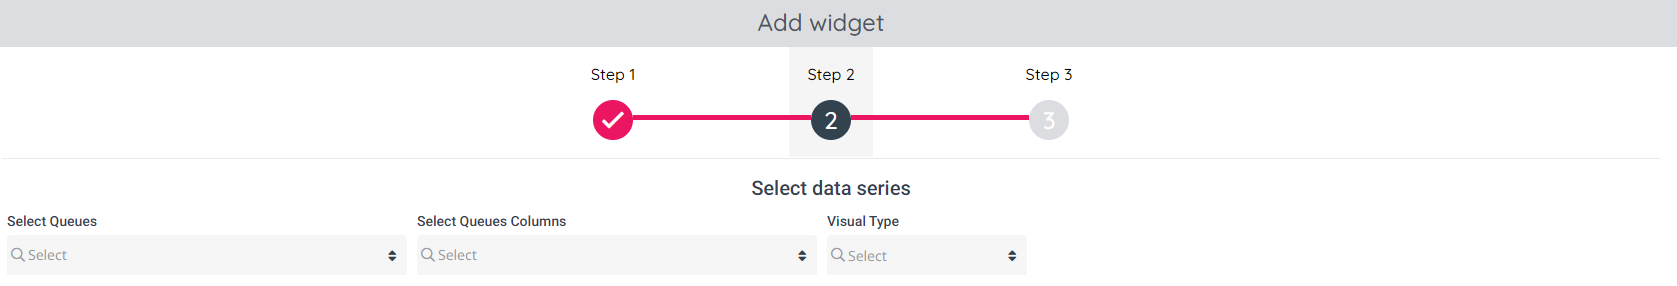
What to select in step 2 varies depending on the widget type you selected in step 1.
In step 2 you need to choose:
- Queues (for widgets Traffic and Queue) and Agents (for widget Agents). In general, the rows.
- Columns.
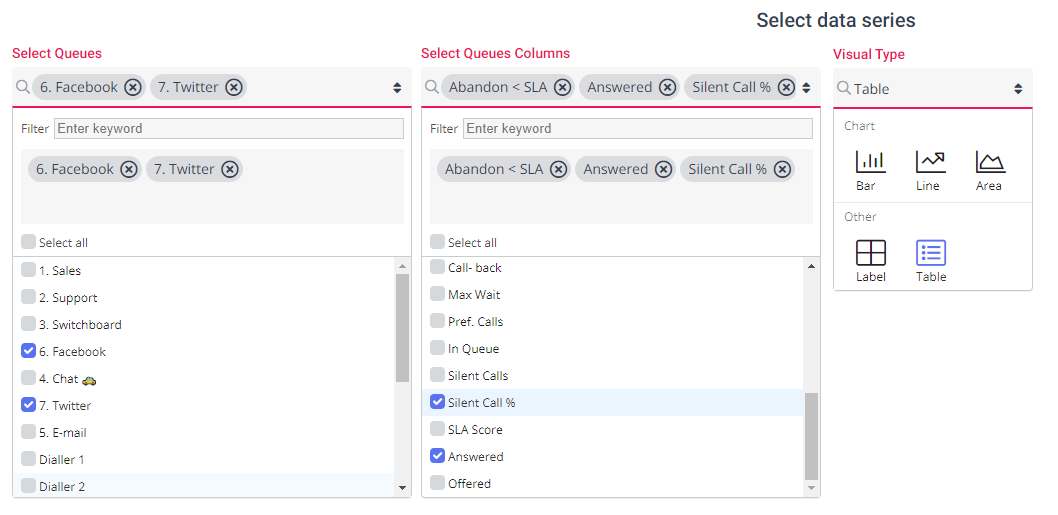
- Visual Type:
- Chart - one or more (max 4) series (columns) of chart data, which may be:
- Bar
- Line
- Area - Label - one or more labels, where each label hosts a single value
- Table - a table to show multiple columns and rows
- Chart - one or more (max 4) series (columns) of chart data, which may be:
- Sorting of rows for visual type Table
- If sorting based on "Value in column" is ticked, but no column is selected, the rows in the table in the widget will be shown sorted alphabetically on Queue/Agent name.
- If you have selected a column to sort rows based on (e.g. number of requests In queue) and ascending or descending, the rows in the table in the widget will be shown sorted based on the values for the selected column, which means that the order might be changed every 10th second.
- If you have ticked Manual sort order, the rows in the table in the widget will be shown in the preconfigured order.
The options are demonstrated in the sample screenshot below (all options opened for demo purposes):
Once step 2 is done, click Next to go to step 3.
Step 3 looks like this:
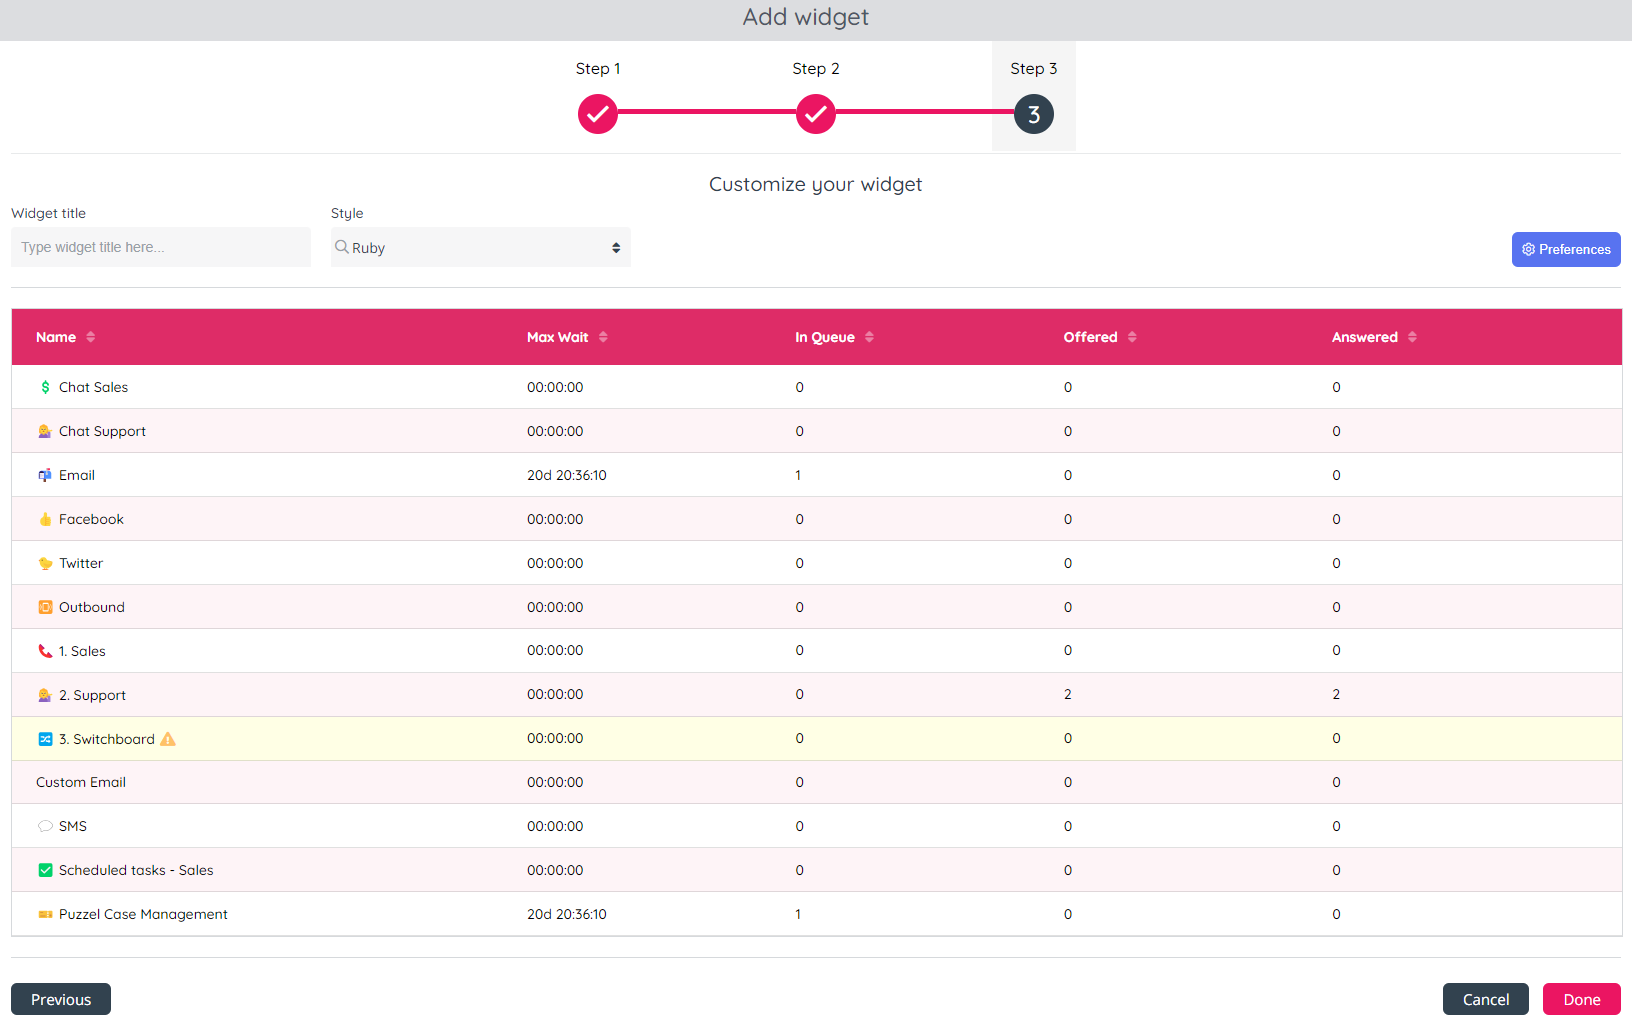
In step 3 you should:
- Add a descriptive Widget title
- Select a Style for the dashboard if you want something else than Default. Select between different colour presets such as "Light", "Dark" or "Ruby"
When you are done, click the "Done" button located on the bottom right.
You will now see the Dashboard with this new widget. Please note that this new widget is not yet saved! Please adjust its position and size and then click the Save icon in the upper right corner.
Delete a Widget
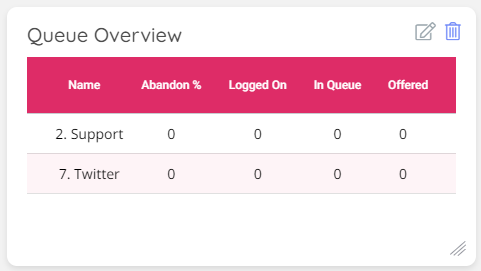
Any widget in a Dashboard can be deleted. To do so, simply click on the delete icon on the top-right corner of the widget container:
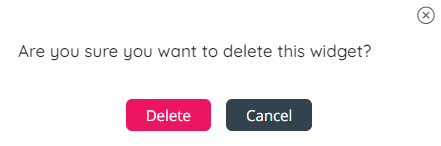
This will trigger a prompt to confirm the deletion of the widget:
Once the "Delete" button is clicked, the widget will be removed from the Dashboard, but it's not yet saved. If you are sure you want to delete the widget, please click "Save" in the upper right corner.
Edit a Widget
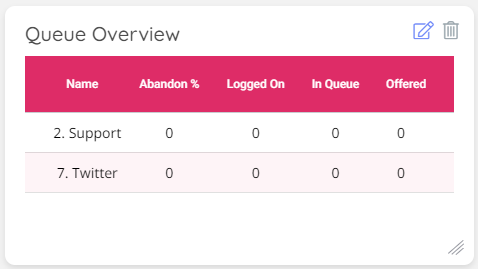
If you want to change something in a widget in one of your Private or Company Dashboards, please click the edit icon in the upper right corner of the widget.
If you click the Edit icon for a widget, step 3 in the configuration wizard opens.
You can do changes in step 3 and/or go to step 2 and do changes here.
When you're done doing changes, click Done in step 3. The changes you made are now shown, but it's not saved. If you are sure you want to save the changes done, please click the "Save" in the upper right corner.