
Using the Dashboard
To access the Dashboard, you can click the HOME icon from anywhere within the platform.
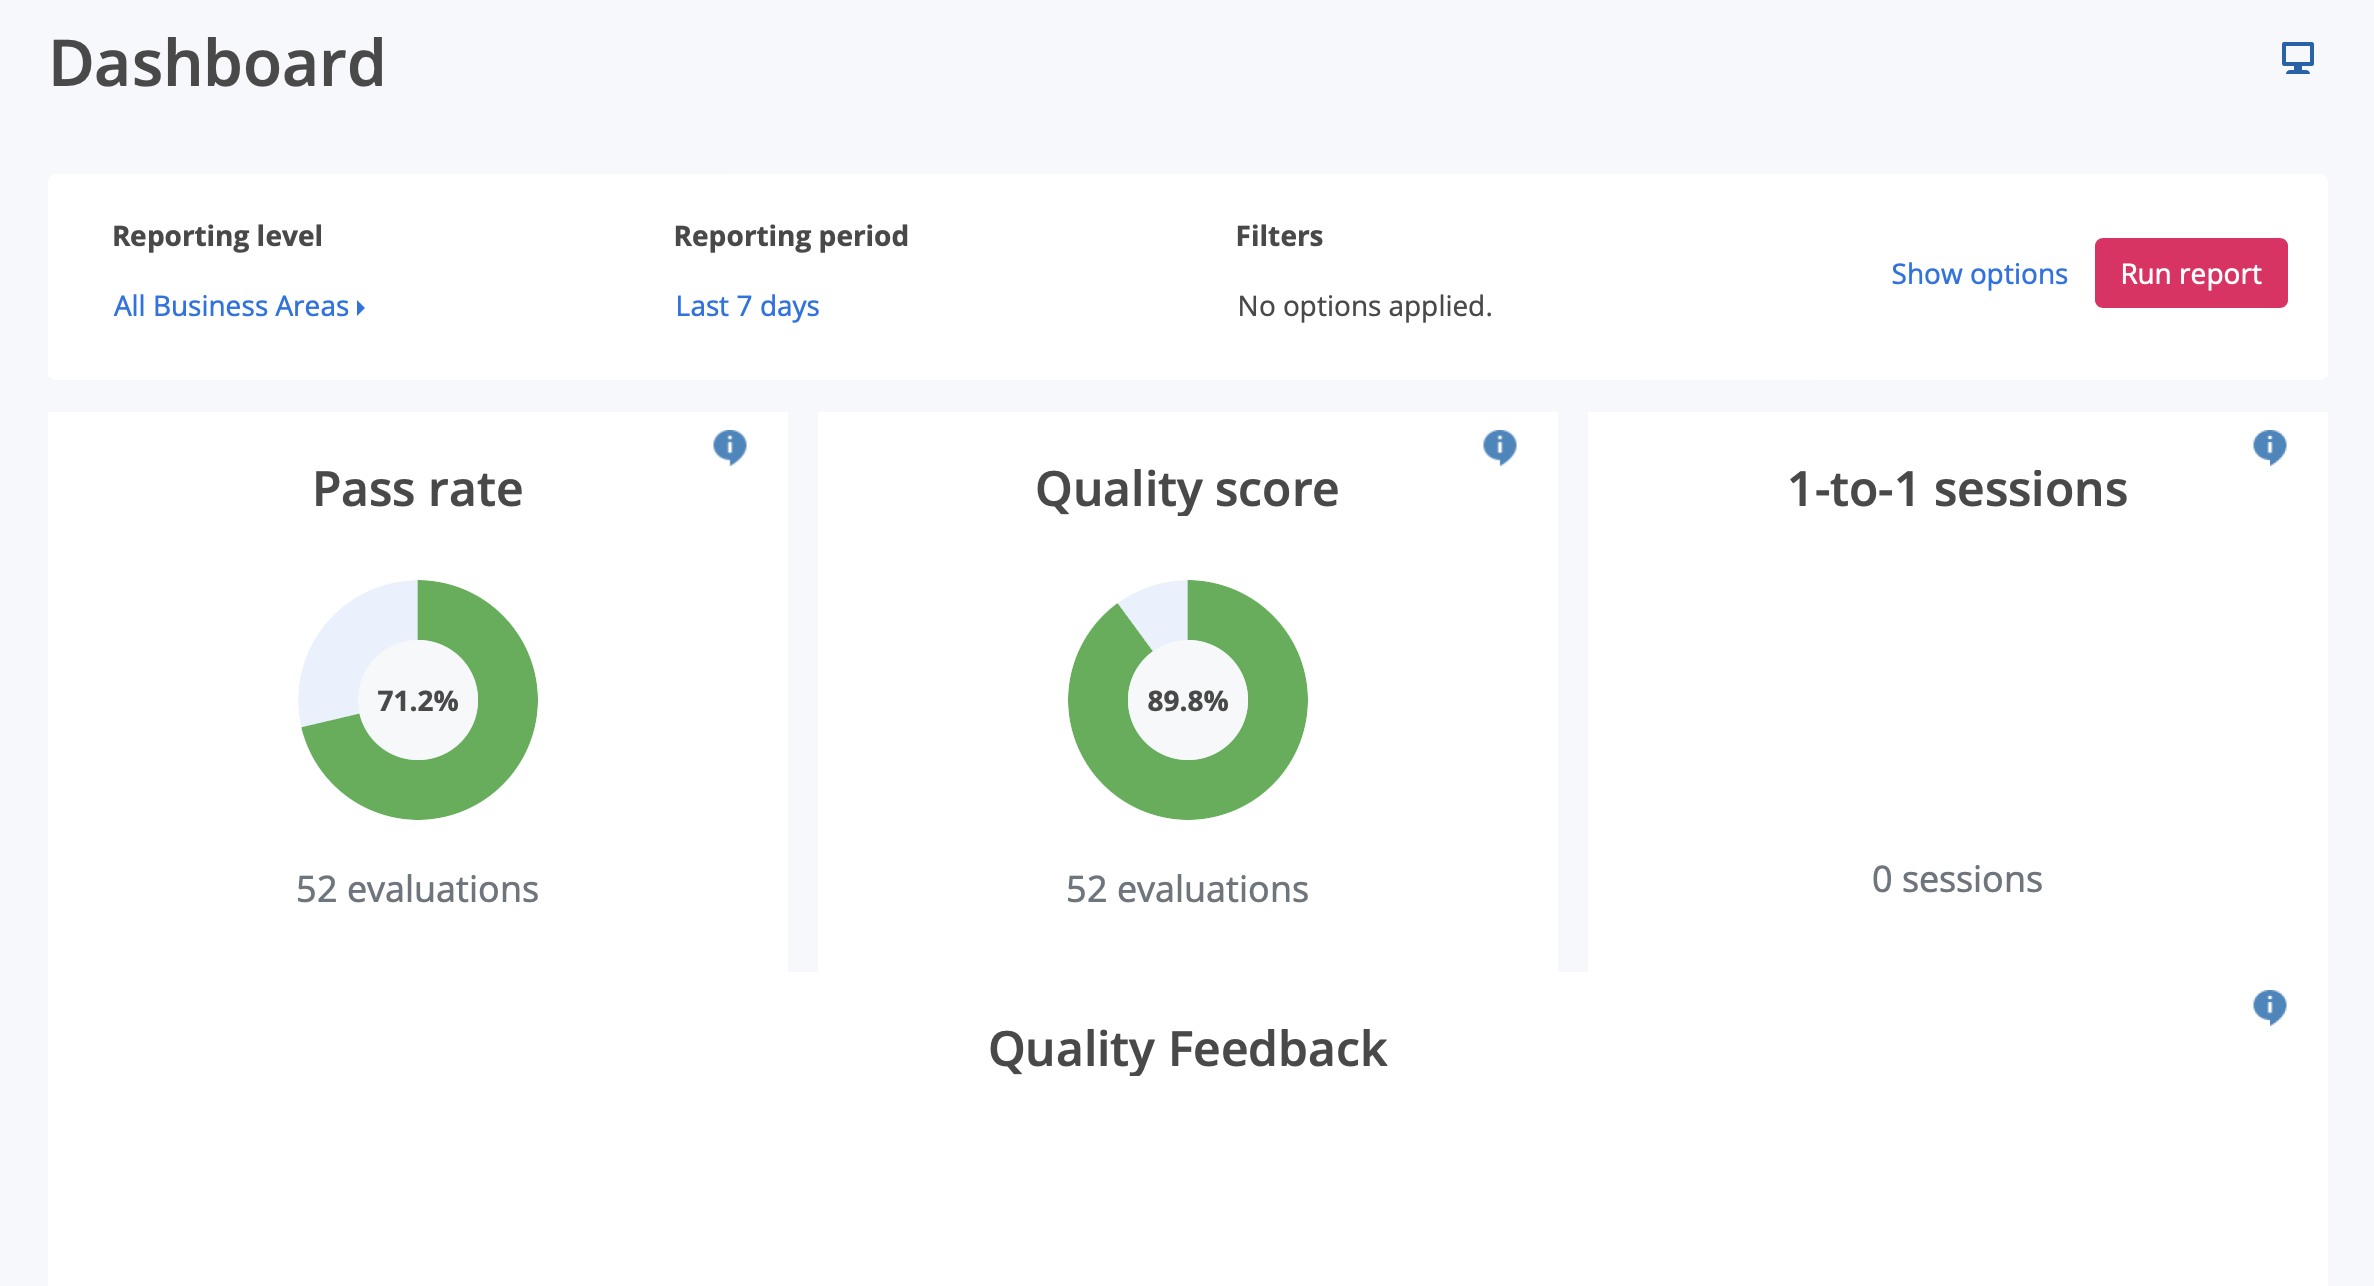
The Dashboard is your first stop overview and summary of quality performance. A great starting point to identify trends to dig deeper into improving quality.
Depending on the level of reporting access that the user has, it will present the high level overview and summary of performance across quality.
The example below includes:
- The Pass rate: the percentage of evaluations that are passing
- The Average quality score across a specified period
- The number of 1-to-1 sessions broken down by topic
Below you can also see a bar graph on Coach and Feedback sessions over time