
Using the Evaluator Performance Report
To access the Evaluator Performance Report:
- Go to REPORTING
- Click Evaluator performance
It is also possible to filter by:
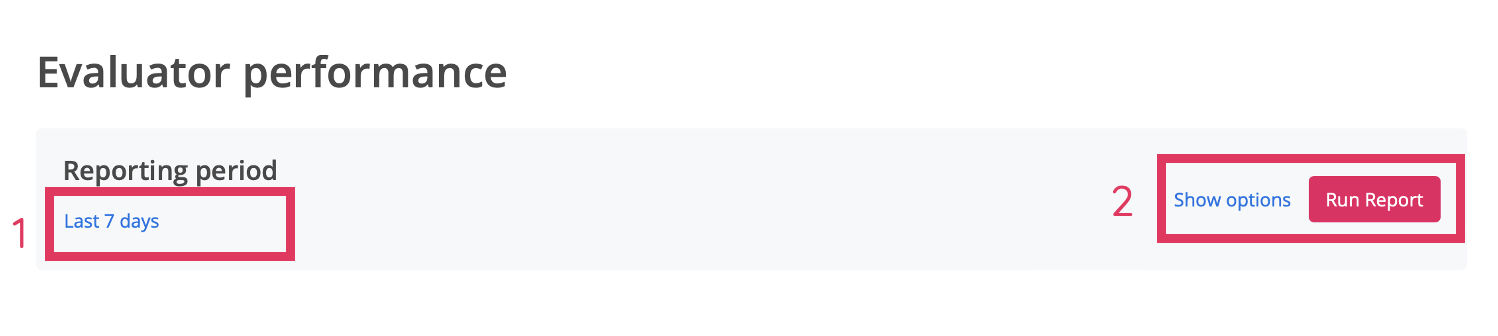
1. Date
2. Scorecards, by clicking the "Show options" button located next to the chosen timeframe and then selecting "Run Report".
This report has 5 tabs:
- Productivity
- Scoring
- Queries
- Reviews
- Feedback & 1-to-1s
Productivity
Based on evaluations published or sent for review in this period, understand team output and productivity. Remember, any variation may be driven based on scorecards
Under Productivity, you can see a table with:
- A list of evaluators
- The number of reports they have published within the selected period
- The Pending list of evaluations
- The total list of evaluations
- The avg. time
Scoring
Based on evaluations published in this period, understand scoring variation (and any potential bias) across the team. Remember, any variation may be driven based on scorecards
Under Scoring, you can see a table with:
- A list of evaluators
- The number of reports they have published within the selected period
- The Avg Quality score
- A bar showing the System Evaluation Outcome (hover over the bar for exact percentages)
- An Actions Column with an icon of a magnifying glass. Click on this icon to be redirected to a page with tabs that indicate scorecards of a certain category and showcase a breakdown of the evaluation outcomes/scores.
Queries
Based on evaluations published in this period, understand the outcome of queries raised. Under Queries, you can see a table with:
- A list of evaluators
- Published
- Pending
- Processed
- Percentage of edited
- An option to "View"
It is also possible to toggle between Evaluator, Querier and Reviewer view (depending on reporting access) from the drop down menu to the left just above the reporting table.
Reviews
Based on evaluations published in this period, understand the outcome of evaluations sent for review prior to publication. Under Reviews, you can see a table with:
- A list of evaluators
- Published
- Total reviews
- Percentage of edited
Feedback & 1-to-1s
Based on feedback and coaching sessions published during this period, understand how each team member is driving improvement through feedbacks and coaching interventions.