
Home Page
Once you have signed in, you will see the Home Page, which is divided into 2 sections: Traffic Information/KPIs, and Useful Information.
When you get access to the NEW Home page, the selected parameters will be shown above the chart and not on the right side.
In the bottom left corner you see your customer name and customer number.
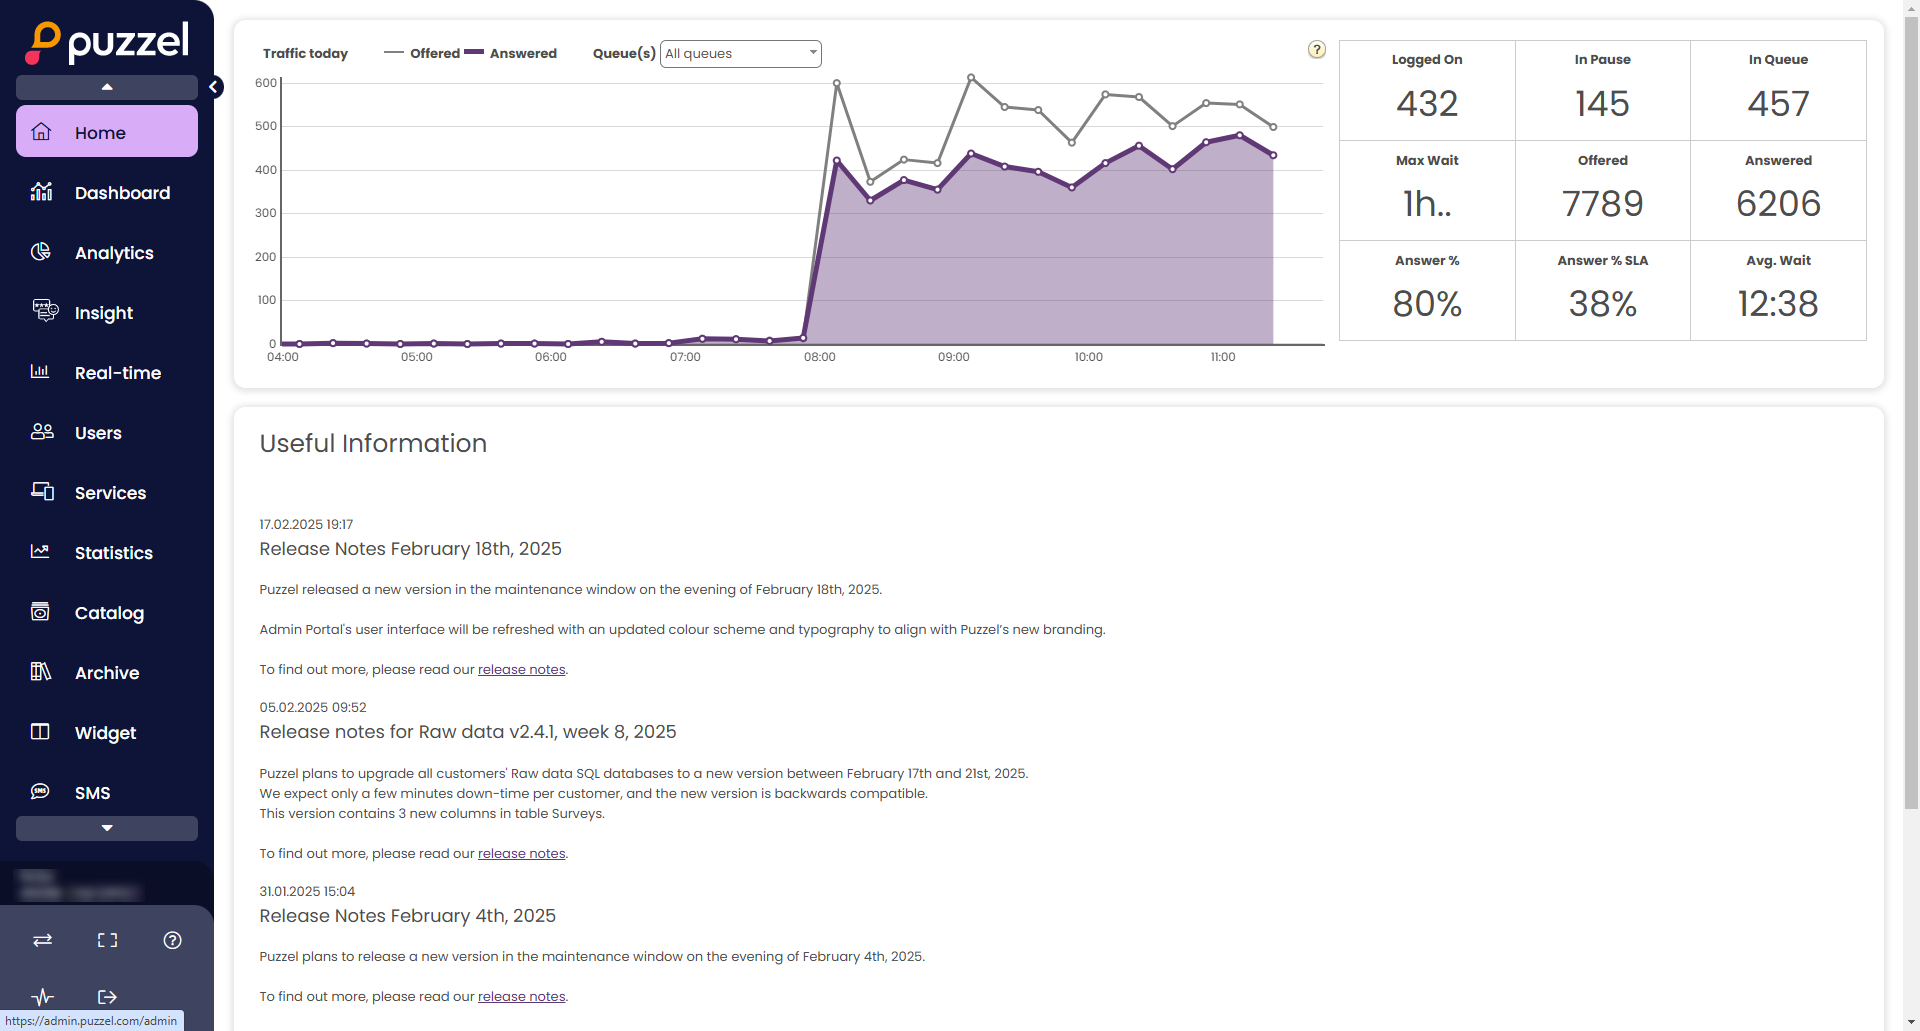
In the chart, you can see the number of requests offered and answered per queue, per quarter of an hour, for the selected display queues (default is all).
On the right side of the chart, you can see values for 4-9 key parameters for the same display queue(s). You can configure what key parameters are shown here on pager Users - Products under Homepage.
Available parameters
Parameter name on Home page | Description |
Answer % | Answer % so far |
Answer % SLA | Answer % within SLA so far |
Avg. Speak | Avg. Speaktime so far |
Avg. Wait | Avg. Wait Time Answered so far |
In Pause | In Pause Now |
In Queue | In Queue Now |
Logged On | Logged On Now |
Max Wait | Max Wait Time Now |
Silent | Silent calls so far |
Survey Score | Survey score so far |
Answered | Total Answered so far |
Offered | Total Offered so far |
By clicking the drop-down menu for Queue(s) you configure if the graph and the key parameters represent All Display queues (the default), just one display queue or a selection of Display queues.
On the bottom part of the Home Page, Puzzel publishes useful information and product news.