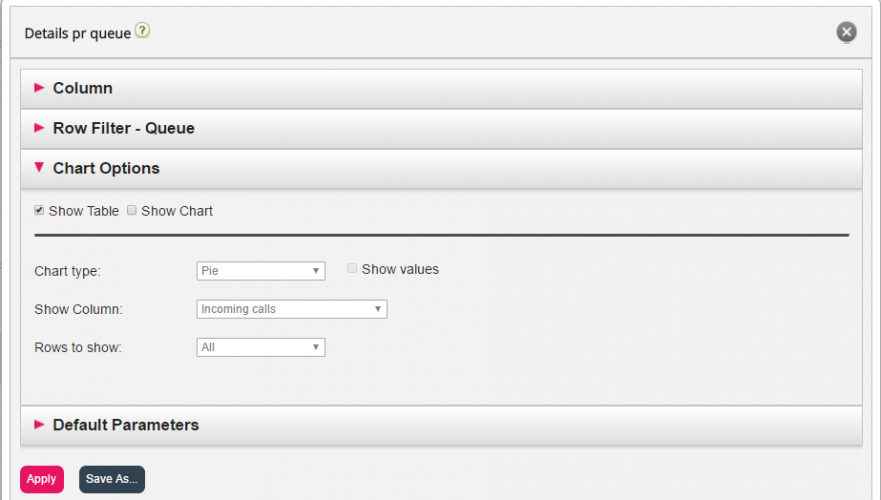
Chart options
Some of the reports have chart options. Here you can select:
- if table and/or chart should be shown
- which column you want to show in the chart
- what kind of chart you want (Pie, Column, or Line chart)
- if all (default) or just the top 5/10/15/20 rows should be shown
If you want to limit what rows that should be included in the chart (other than top x rows), you can use the Row filter and manually select rows that should be included.

