
KPI Alarms in Dashboard
KPI alarms can be configured on system queues on page Services - Queues, and when an KPI alarm is triggered, it's visualised on Queue overview, on Wallboard for queues and in the Dashboard's real-time Queue widgets.
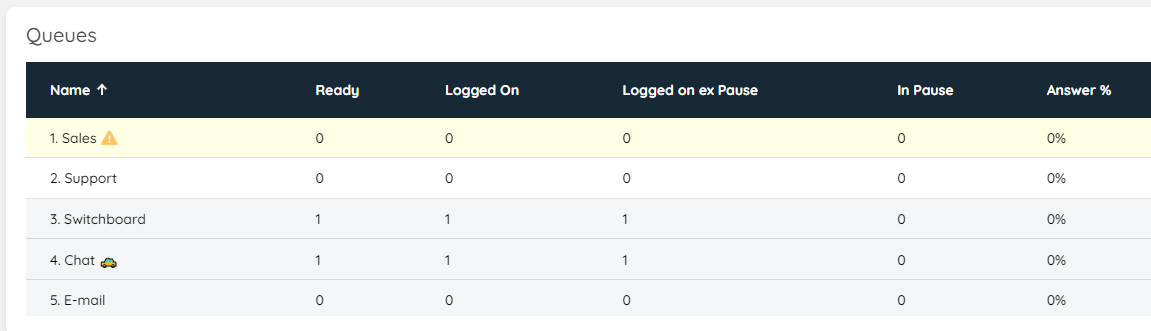
Within the dashboard, the visual effect is similar to that of the queue overview and looks like this:
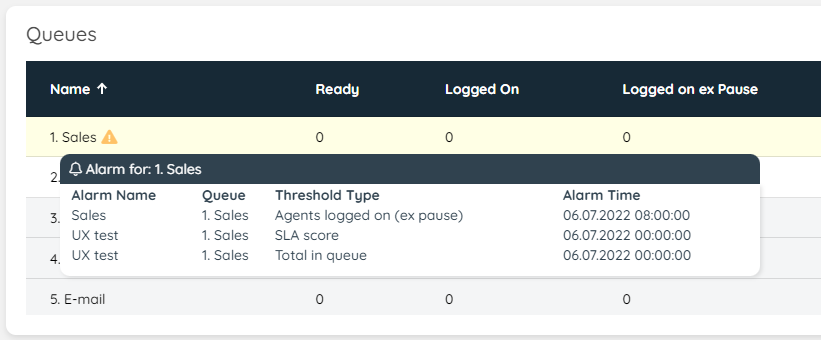
In addition to this, there is more detailed information on each KPI alarm active, which can be activated and shown, by hovering over the "!"element on the row. The additional information looks like this:
Each alarm is visualised for as long as the alarm is active. As soon, as the condition is no longer met, the visual effects associated with the alarm will not be shown.