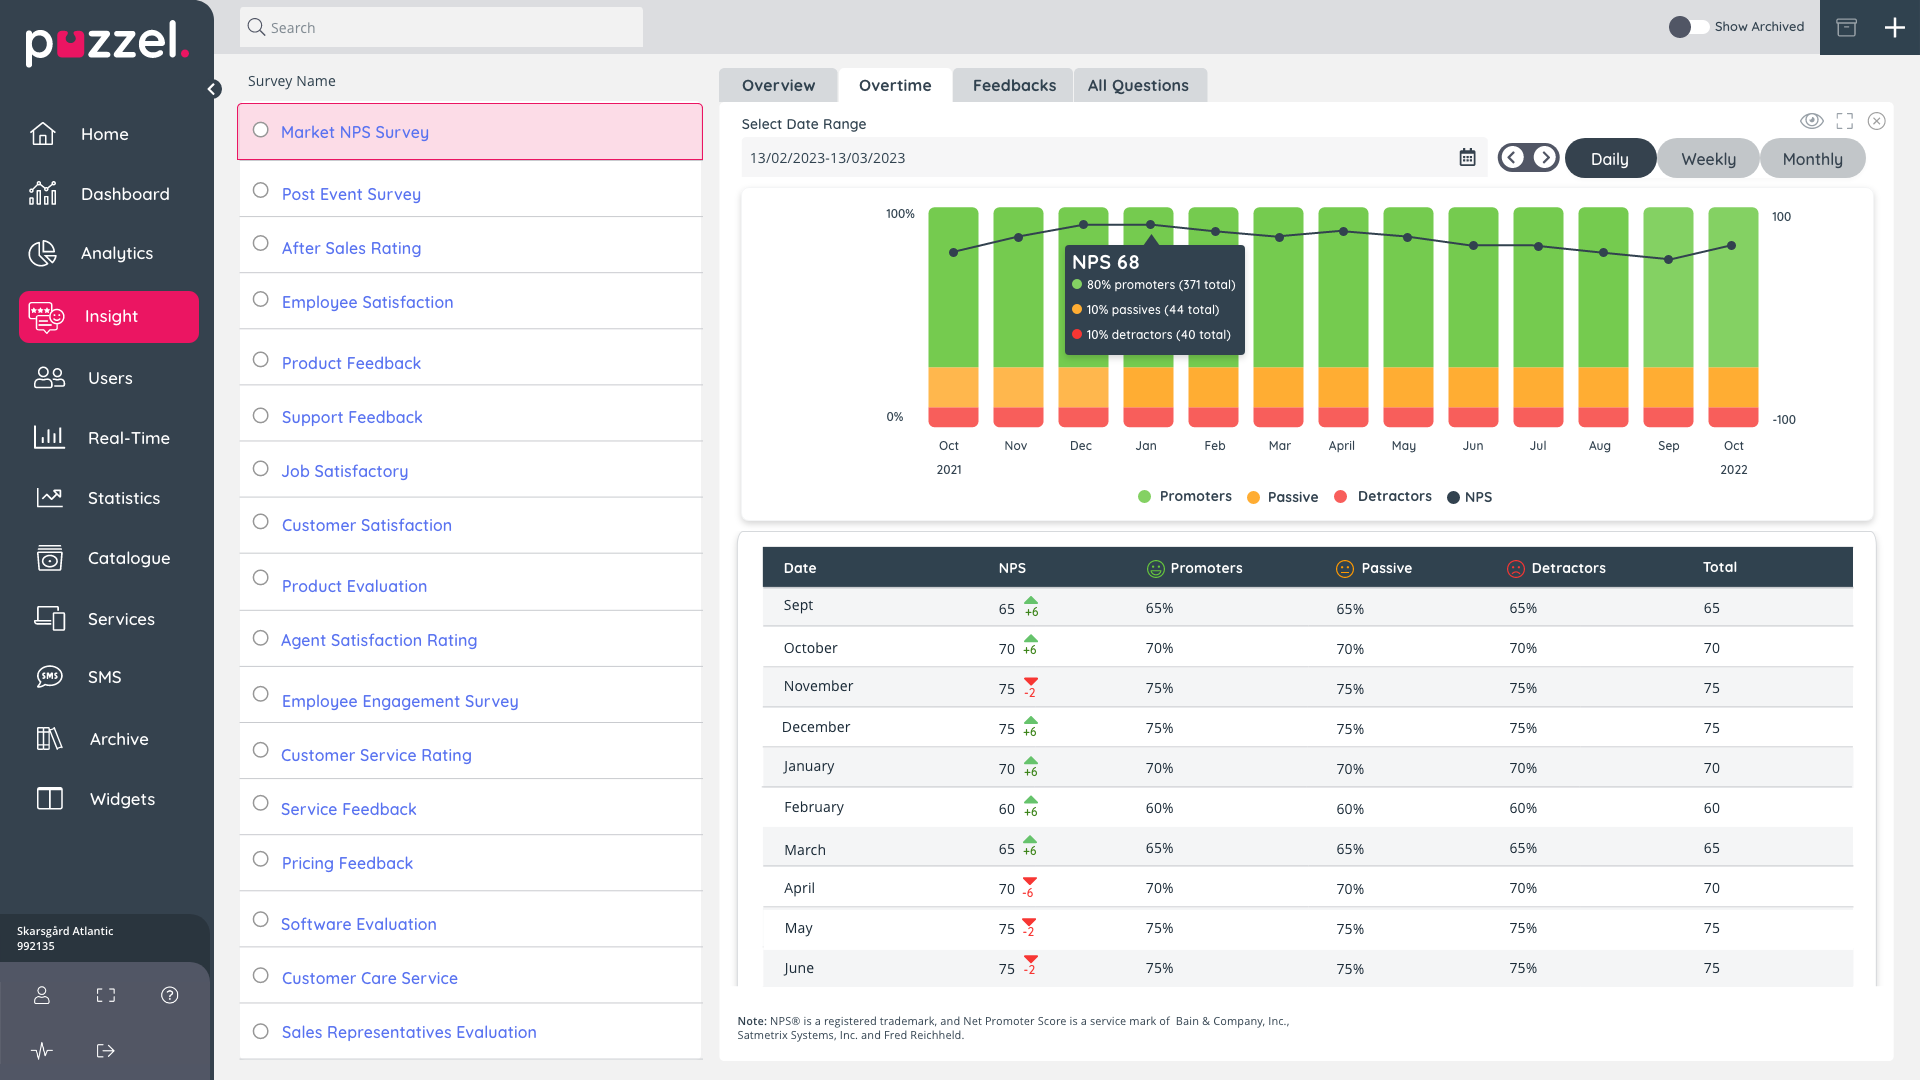
The Over Time view allows you to see how the results have fluctuated over time.
The first section is a bar chart with yearly intervals that allows you to view the Promoters, Passives and Detractors in your surveys over time.
Underneath the bar chart there is a table with specific information on the results, including:
NPS
|
CSAT
|
CES
|
PMF
|
|
Date of survey
|
Date of survey
|
Date of survey
|
Date of survey
|
|
NPS score
|
NPS Score
|
CES Score
|
PMF Score
|
|
Percentage of Promoters
|
Percentage of Satisfied
|
Percentage of Agreed
|
Percentage of Very Disappointed
|
|
Percentage of Passives
|
Percentage of Neutral
|
Percentage of Neutral
|
Percentage of Mildly Disappointed
|
|
Percentage of Detractors
|
Percentage of Dissatisfied
|
Percentage of Disagreed
|
Percentage of Not Disappointed
|
|
Total
|
Total
|
Total
|
Total
|
|