
The analytics overview
The overview tab shows an overview of the survey’s results.
Key Analytics
Under the Date Range selection bar, you can find the key analytics of each survey. This view varies between templates.
NPS |
CSAT |
PMF |
CES |
|
Number of Promoters |
Number of Satisfied users |
Number of Very Disappointed users |
Number of users that agree |
|
Number of Passives |
Number of Neutral users (where applicable) |
Number of Mildly Disappointed users |
Number of Neutral users |
|
Number of Detractors |
Number of Dissatisfied users |
Number of Not Disappointed Users |
Number of users that Disagree |
|
Surveys Sent |
Surveys Sent |
Surveys Sent |
Surveys Sent |
|
Total Responses |
Total Responses |
Total Responses |
Total Responses |
|
Response Rate |
Response Rate |
Response Rate |
Response Rate |
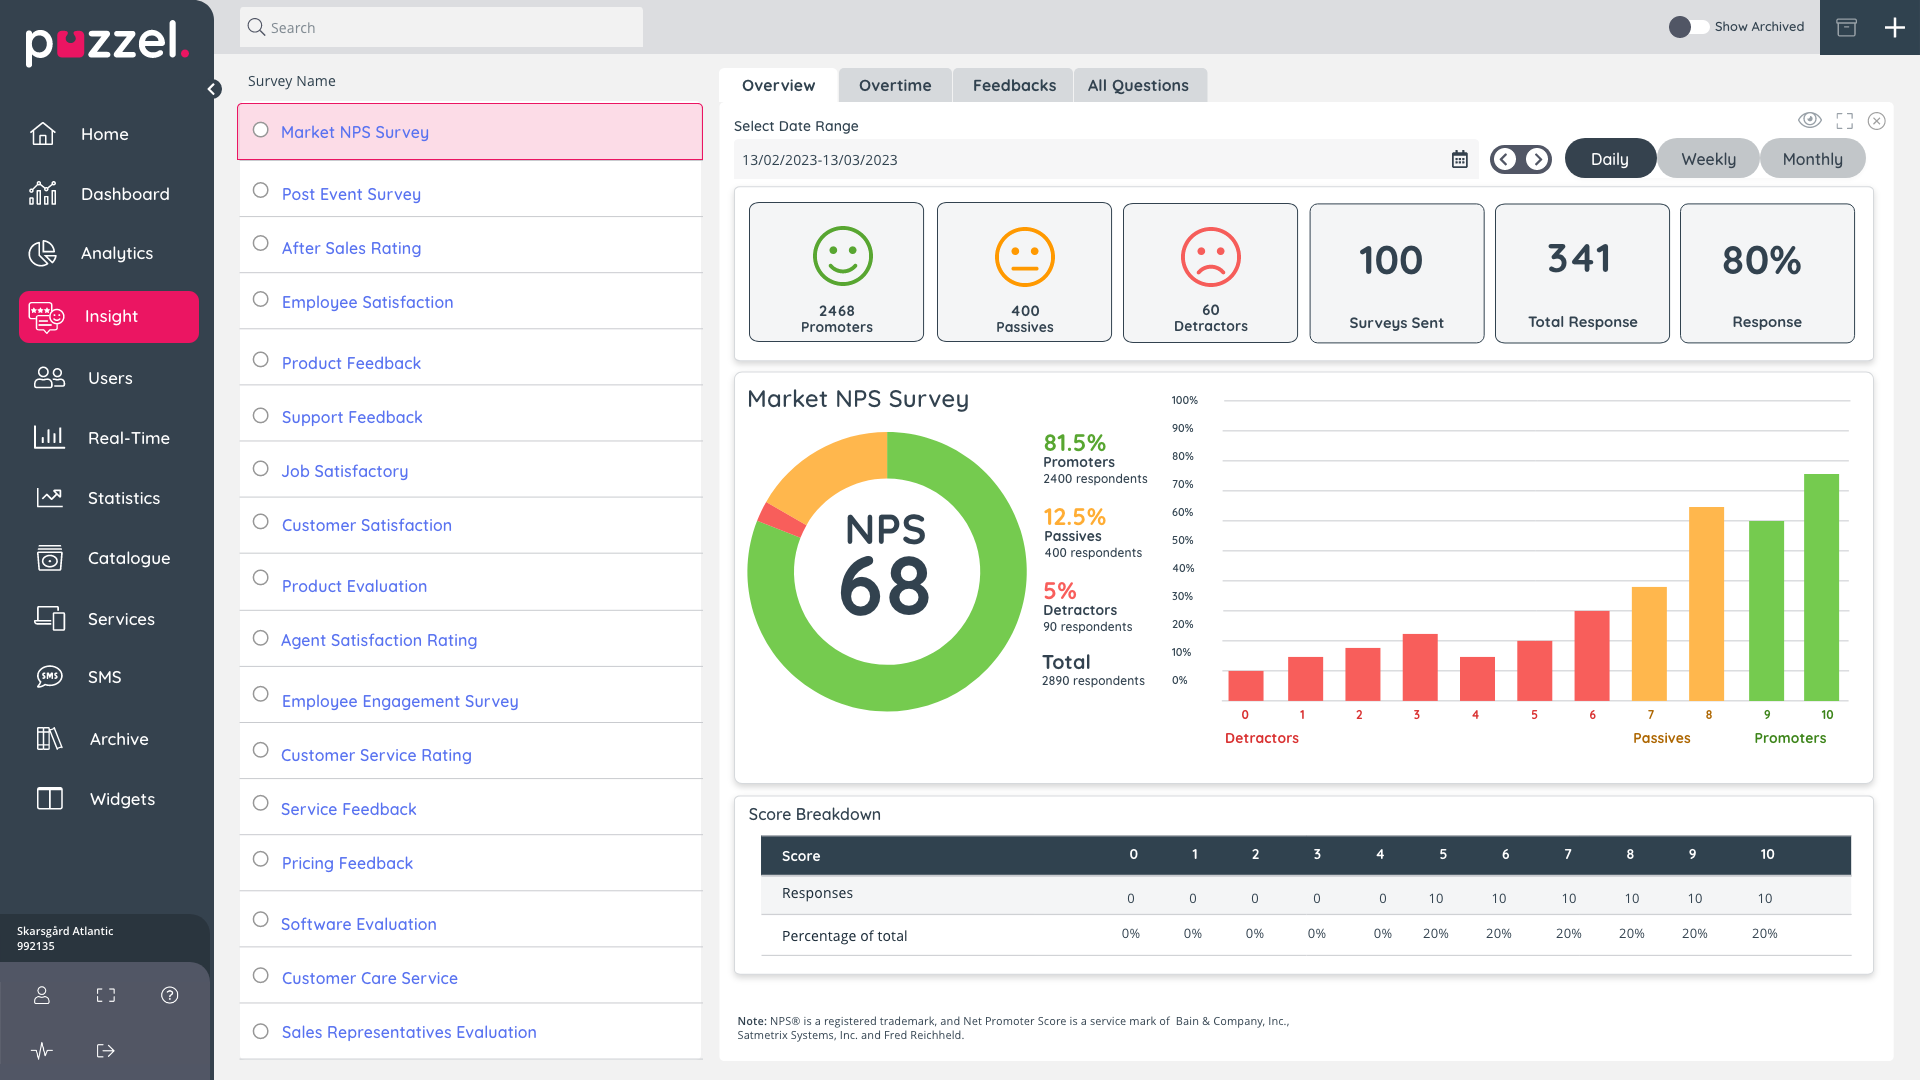
This is what the Overview tab looks like for the NPS survey type:
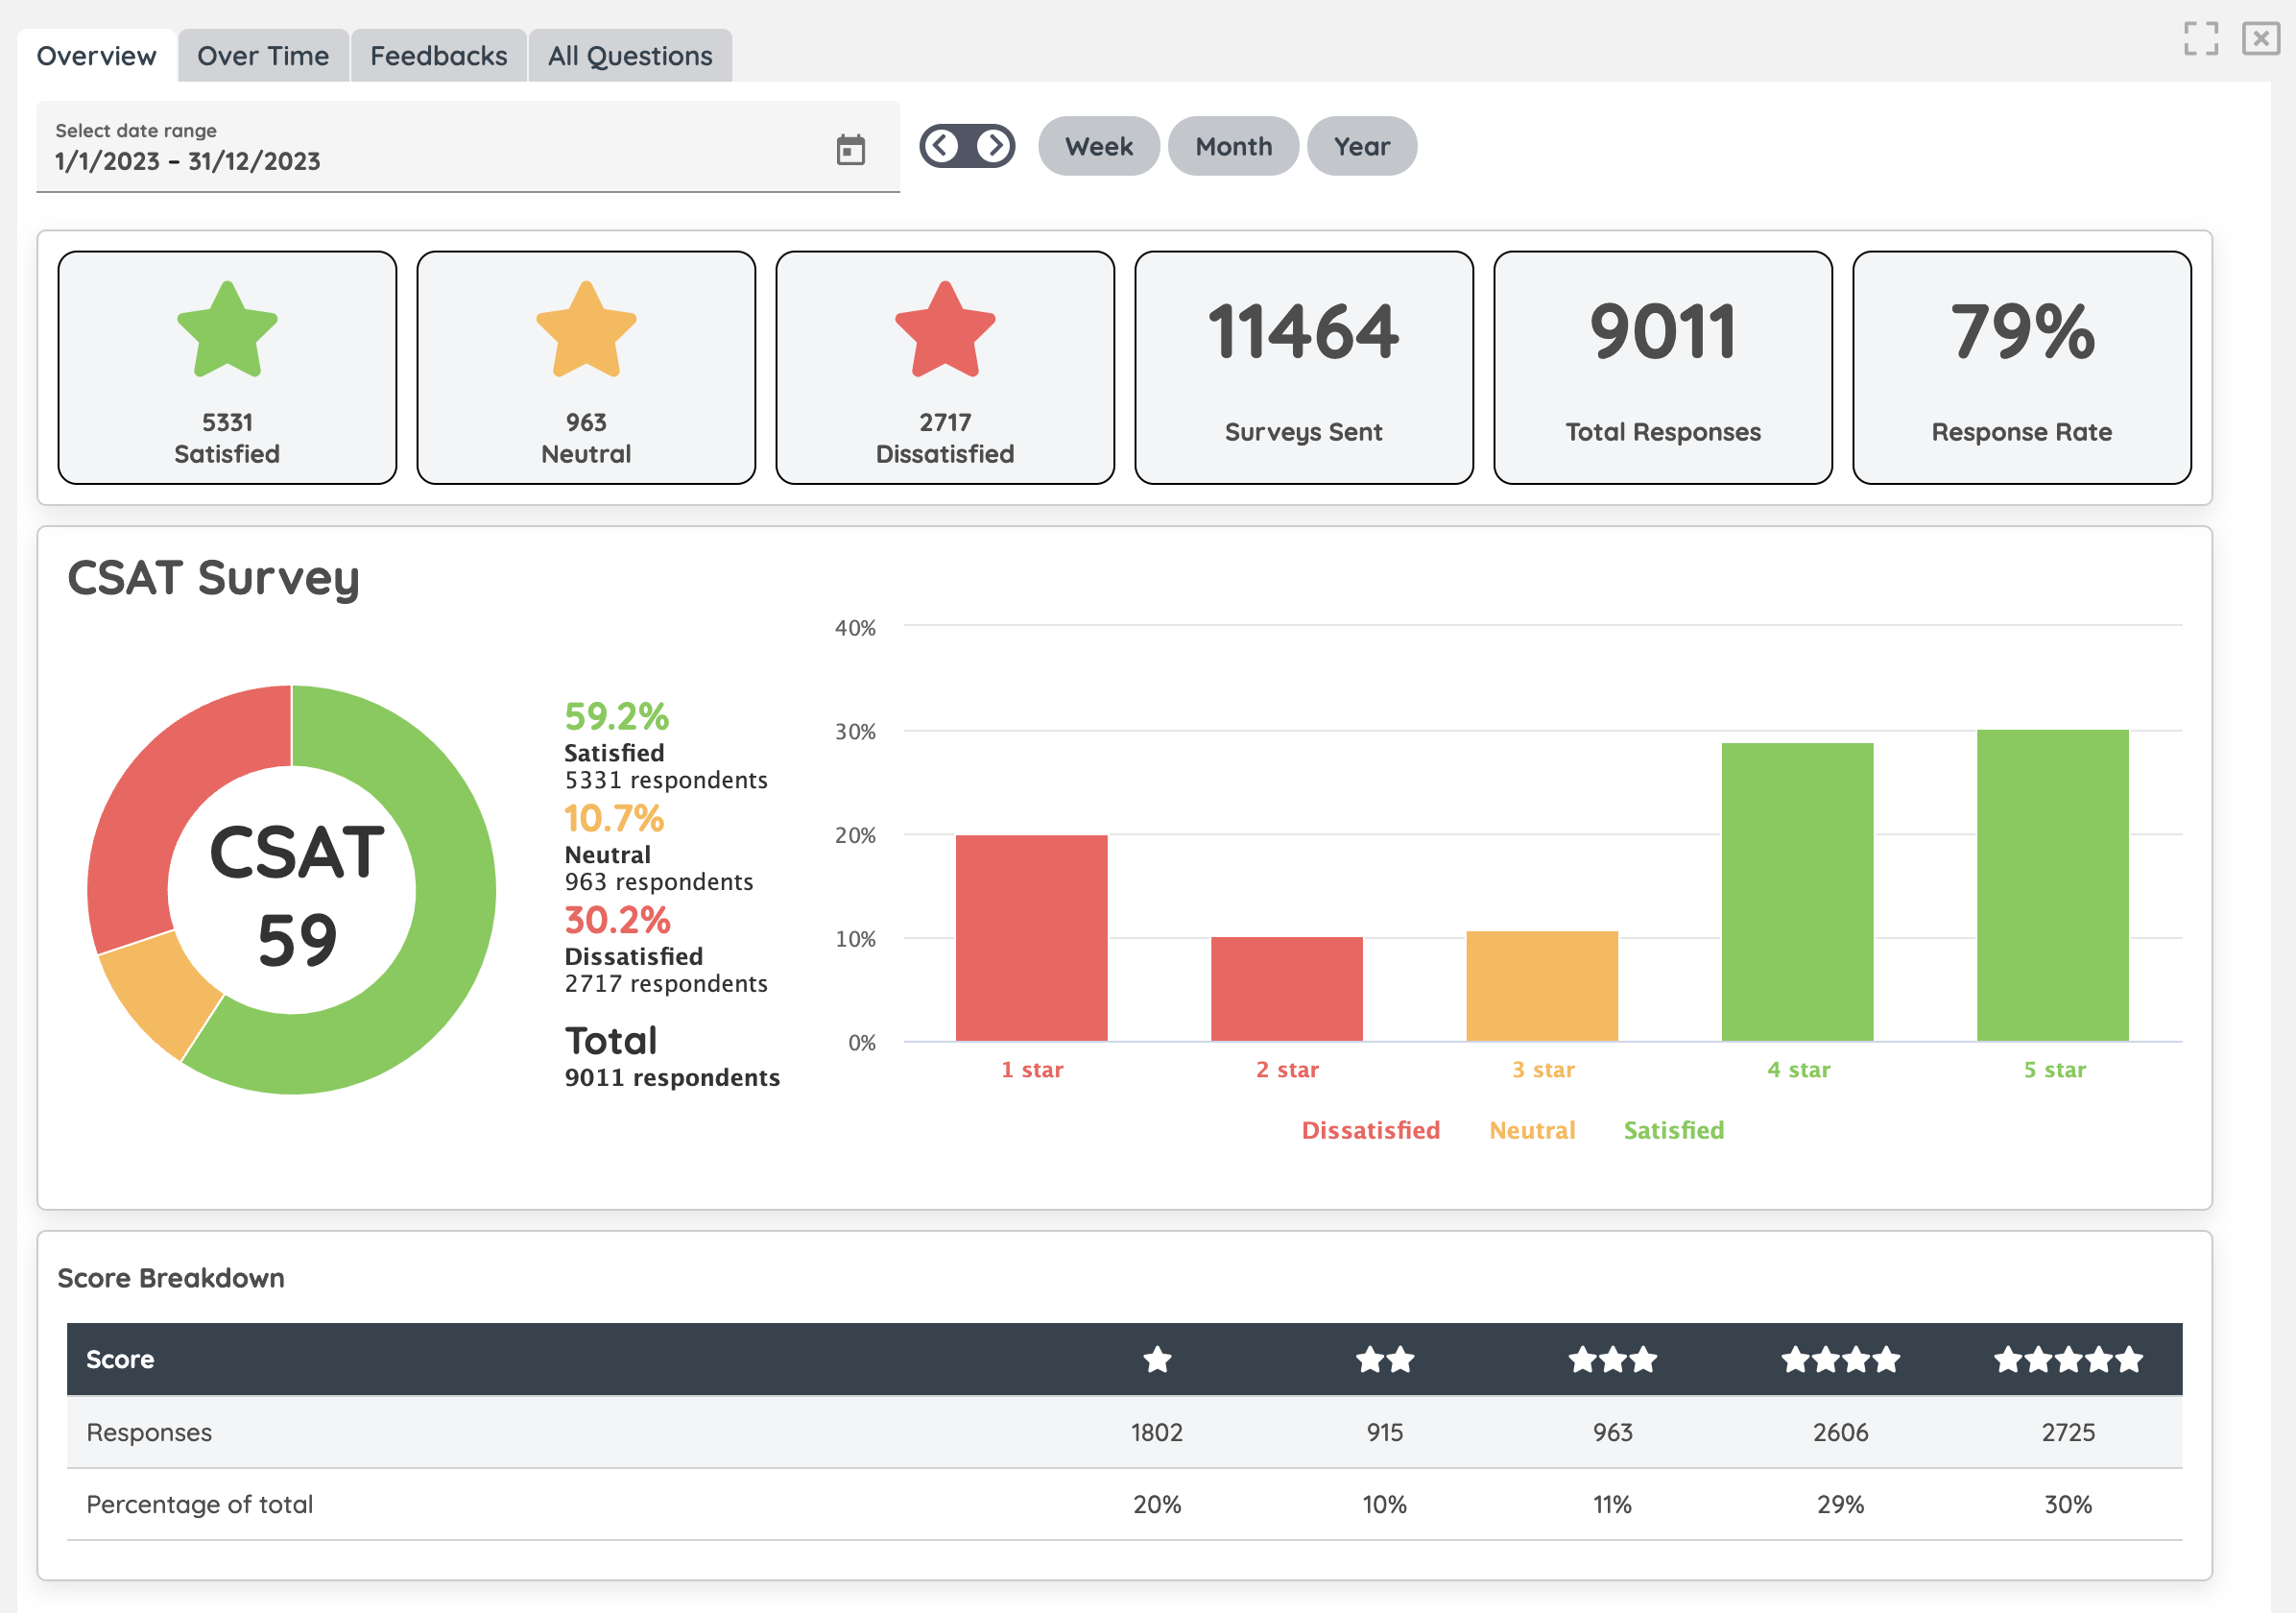
This is what the Overview tab looks like for the CSAT survey type:
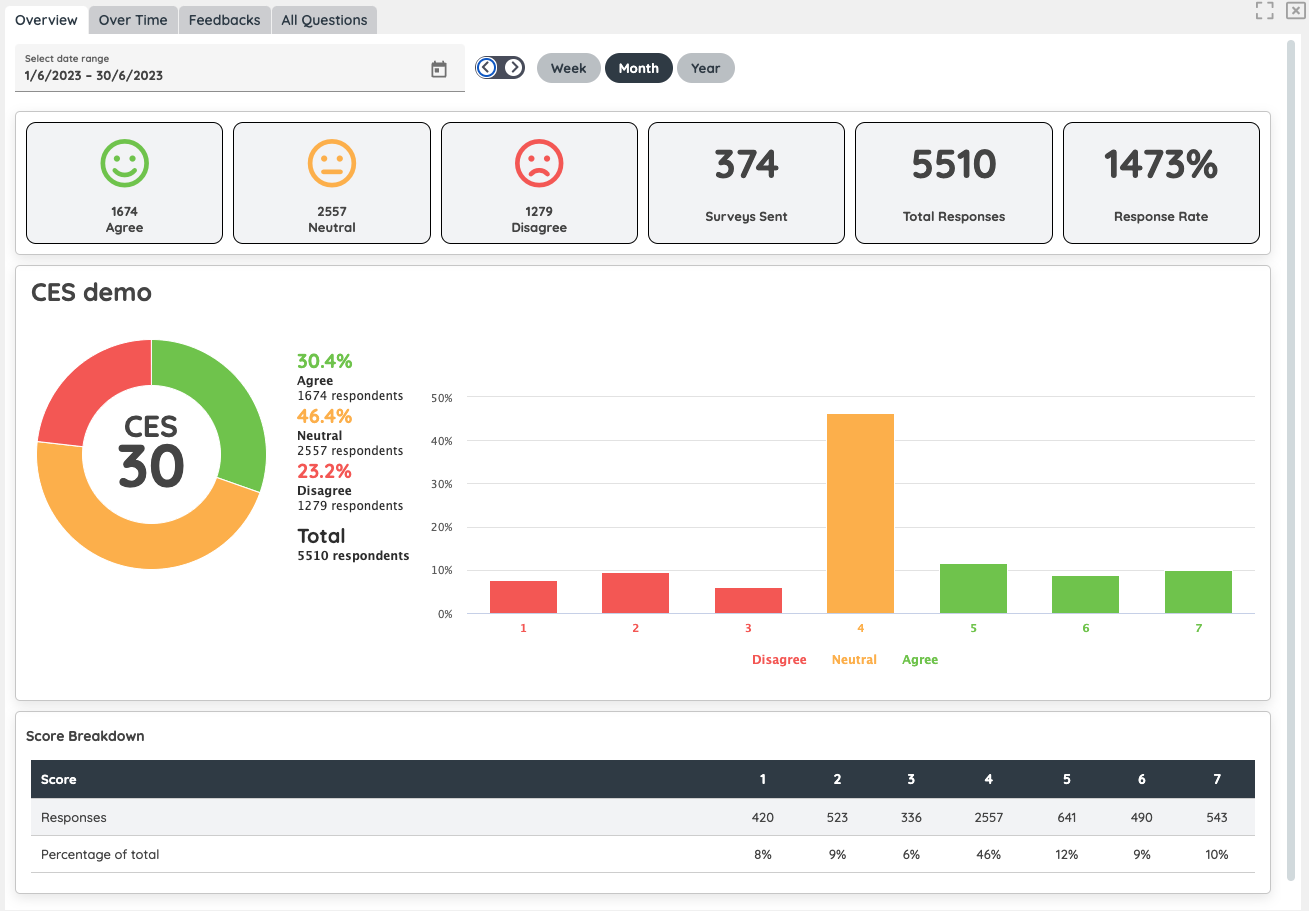
This is what the Overview tab looks like for the CES survey type:
This is what the Overview tab looks like for the PMF survey type:

Under the Key Analytics section there is an Overview board with the Survey’s title. Here you ‘ll find:
- A pie chart
- The percentages of positive, neutral and negative responses
- The total responses
- A bar chart
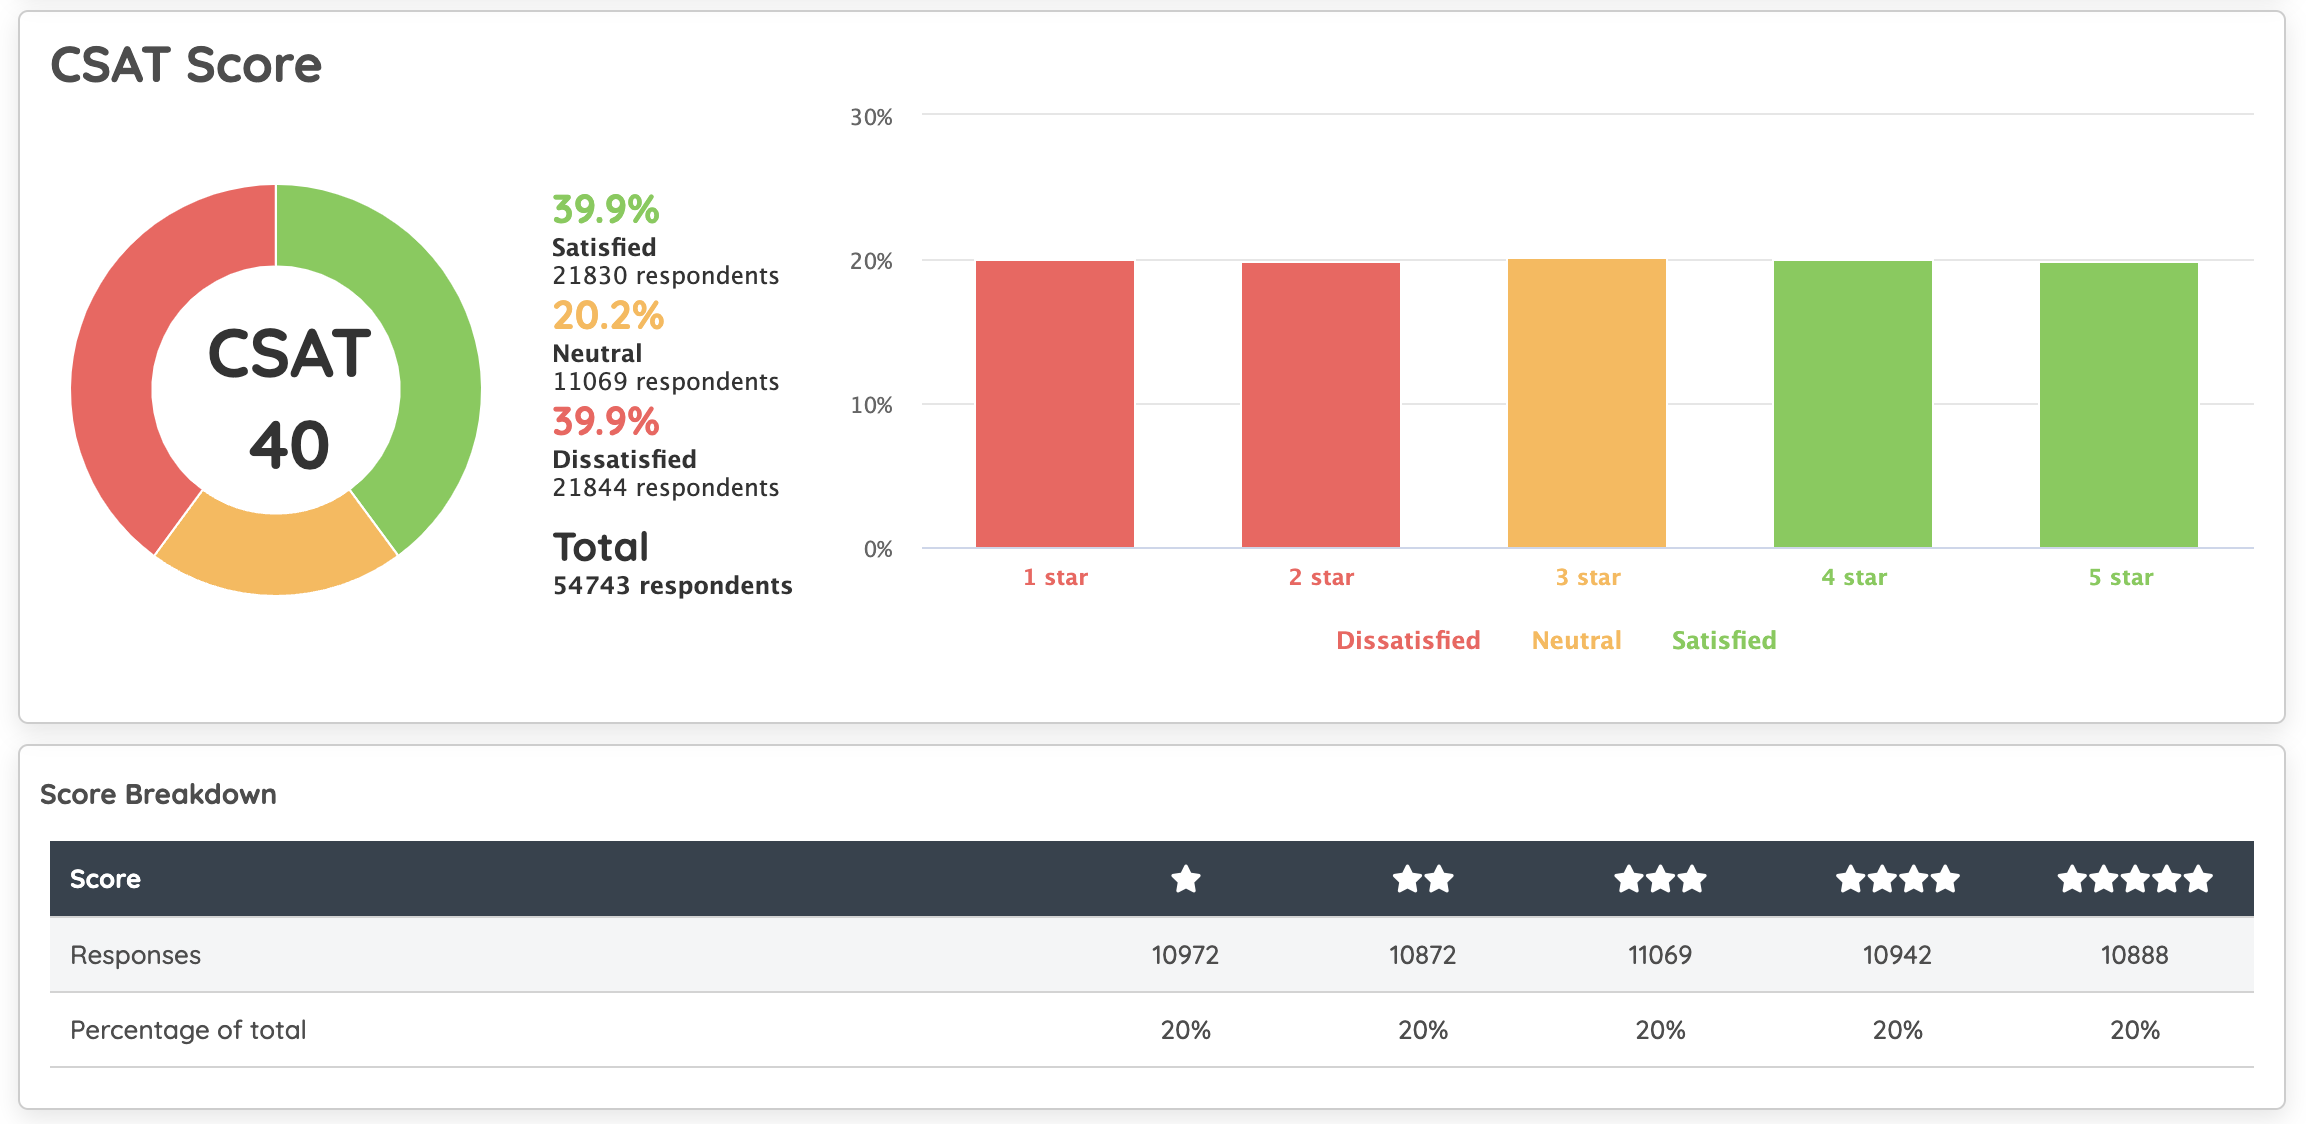
Score Breakdown
The last part of the Overview tab is a table with the Score, responses, and Percentage of Total.
Video Tutorial
Watch our video tutorial on how to use the analytics overview tab below: