
Real-time widgets
In a Dashboard you can have Real-time data widgets and/or Historical report widgets.
This article provides an overview of the real-time data widgets that's available in the Supervisor Dashboard:
- Traffic (offered and answered per queue so far today)
- Queue (lots of real-time and so far today parameters per queue)
- Agents (lots of real-time and so far today parameters per agent)
Once a real-time Widget is selected (in Step 1), you can further choose the Queues/Agents for this Widget, along with the specific fields - for example Average Handle time, Ready, Logged On, etc. Below, one can find a list of the available widgets, along with the first and second data selection fields available for them.
Traffic Widget
This widget contains information about offered and answered requests for one or more queues, similar to what is shown on the Home page:

Once selected, click Next to go to step 2 to select:
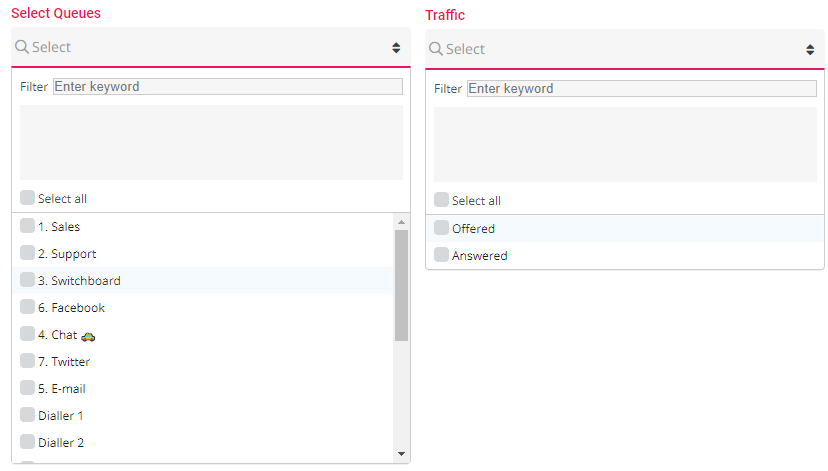
- Queues - in the list that shows all available Display Queues, select one, more or all queues.
- Traffic - in the list that shows Offered and Answered, select one or both
- Offered - number of offered requests (=arrived in queue) so far today
- Answered - number of answered requests (=answered/accepted by agent) so far today
This is demonstrated in the screenshot below:
Queue Widget
This widget contains the same metrics per Display Queue as is used in Ticker Queues, Wallboard for Queues and Queue overview:
Once selected, click Next to go to Step 2 to select 1) Queues, 2) Columns and 3) Visual type:
- Queues - In the list showing all available Display Queues, select one, more or all queues.
- Queues Columns - these fields are the actual fields to choose from. Select one or more of the available fields:
| Dashboard label | Type | Description | |
|---|---|---|---|
| 1 | Abandon % | So far today | Number of callers (chatters) that hung up in queue within the defined SLA time, relative to callers (chatters) offered to queue, so far today |
| 2 | Abandon < SLA | So far today | Number of callers (chatters) that hung up in queue within the defined SLA time, so far today |
| 3 | Abandoned | So far today | Total number of callers (chatters) that hung up in queue, so far today |
| 4 | AHT | So far today | Average handling time (speak time + wrap up time), so far today |
| 5 | Answer % | So far today | Number of Answered requests relative to Offered requests, so far today. Please note that a call (request) still in queue is counted as Offered but yet not as Answered (or Hung up)! |
| 6 | Answer % SLA | So far today | Number of requests Answered within SLA, relative to Offered requests, so far today |
| 7 | Answer% SLA ex. abandon | So far today | Number of requests Answered within SLA, relative to (Offered requests - Hang ups), so far today |
| 8 | Answer% SLA ex. abandon SLA | So far today | Number of requests Answered within SLA, relative to (Offered requests - Hang ups within SLA), so far today |
| 9 | Answered | So far today | Number of Answered requests, so far today |
| 10 | Avg. Speak | So far today | Avg. agent speak time for the requests that have been answered, so far today |
| 11 | Avg. Wait | So far today | Avg. wait time in queue for the requests that have been answered, so far today |
| Avg. Wait now | For those in Queue right now | Will be removed soon! Avg. wait time in queue for the requests currently waiting in queue. Please note that this value usually is around half of what the wait time these requests will have before they are answered, since some requests have just arrived in queue and some have been waiting for a while. | |
| 12 | Avg. Wrap-up | So far today | Avg. agent wrap-up time for calls, so far today |
| 13 | Call-back | Status now | Number of call-backs in queue now |
| 14 | Connected | Status now | Number of agents in status Connected now |
| 15 | In Pause | Status now | Number of agents in status Pause (any Pause reason) now |
| 16 | In Queue | Status now | Total number of calls (requests) in queue now, including callbacks |
| 17 | Logged On | Status now | Total number of agents logged on to queue now, including agents in status Pause |
| 18 | Logged on ex Pause | Status now | Number of agents logged on to queue now, excluding agents in status Pause |
| 19 | Max Wait | Status now | The longest wait time amongst the requests in queue now |
| 20 | Offered | So far roday | Total number of requests Offered to queue, so far today (offered to = arrived in) |
| 21 | Pref. Calls | Status now | Number of requests in queue right now that has a reserved/preferred agent |
| 22 | Ready | Status now | Number of agents in status Ready now |
| 23 | Silent Call % | So far today | Silent calls so far today, relative to (answered Dialler calls + Silent call), so far today. Only relevant for Dialler queues |
| 24 | Silent Calls | So far today | Number of Dialler contacts that have experienced a Silent call, so far today. Only relevant for Dialler queues |
| 25 | SLA Score | Status now | The Display queue's SLA score now (the highest SLA score for requests in the system queue(s) in this Display queue) |
| 26 | Survey Score | So far today | Avg. Survey score so far today |
| 27 | Scheduled | Status now | Number of requests with a scheduled time in the future. (After the scheduled time, the request will be shown as In queue) |
These are the same as the columns available in a Queue Wallboard, ref Queue settings for Wallboard.
Some of the available columns are shown in the screenshot below:

Finally, you need to select Visual type. If you selected more than 4 columns, only Table is available.
Agents Widget
This widget contains the same metrics per Agent as is used in Ticker Agent and Wallboard for Agents:
Once selected, click Next to go to Step 2 to select 1) Agents, 2) Columns and 3) Visual type.
- Agents - select the agents you would like to see details for in the Agent Widget.
- Agent Columns - select the columns you would like to see for each agent:
- Agent Status - Ready, Connected, pause name etc. For an agent that has been offered a written request but not yet accepted it, we show a "+" next to the agent's status, e.g. "Ready (0+)"
- Time in Status
- Answered - number of requests answered/accepted so far today.
- AHT - average handling time (speaktime + wrap-up) so far today.
- Logged on (ex pause) - Time logged on so far today.
- Time Paused - Time in pause statuses so far today.
- User Group - The agent's user group
- Phone Number - The phone number the agent is logged on to queue with.
- Profile name - Name of profile used now
- Open Dialogs - Number of written requests (chats, emails/tasks and SoMe) open now
- Offered Requests - Number of requests offered to agent so far today.
- Avg. Speaktime - Average speaktime for requests answered so far today
- Avg. Wrap-up - Average wrap-up for requests answered so far today
- Logged on (inc pause) - Time logged on to queue (including pause) so far today.
- Total speaktime - Total speaktime for answered calls/requests so far today
The list is demonstrated in the screenshot below:
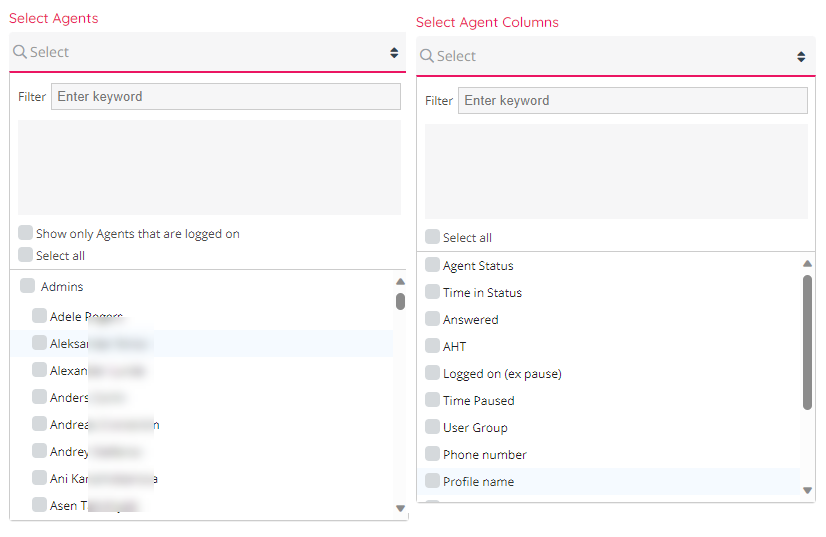
In the Select Agents list box, all users (agents and admins) are shown, in the User group they belong to. If you would like to select all agents currently in a user group, you can tick this User group's name, and when done, all the users in the user group are ticked and added to the list of agents included. If you later add a new user to this user group, this new user is not automatically added to this Dashboard widget.
If you select a lot of agents and you only want to see the agents logged on to queue now in the Dashboard widget, please tick "Show only agents that are logged on".