
Queue Overview
The queue overview enables you to monitor both agents and queues in your contact centre, per display queue. (See Display Queue Settings). The page refreshes automatically every 10th second.
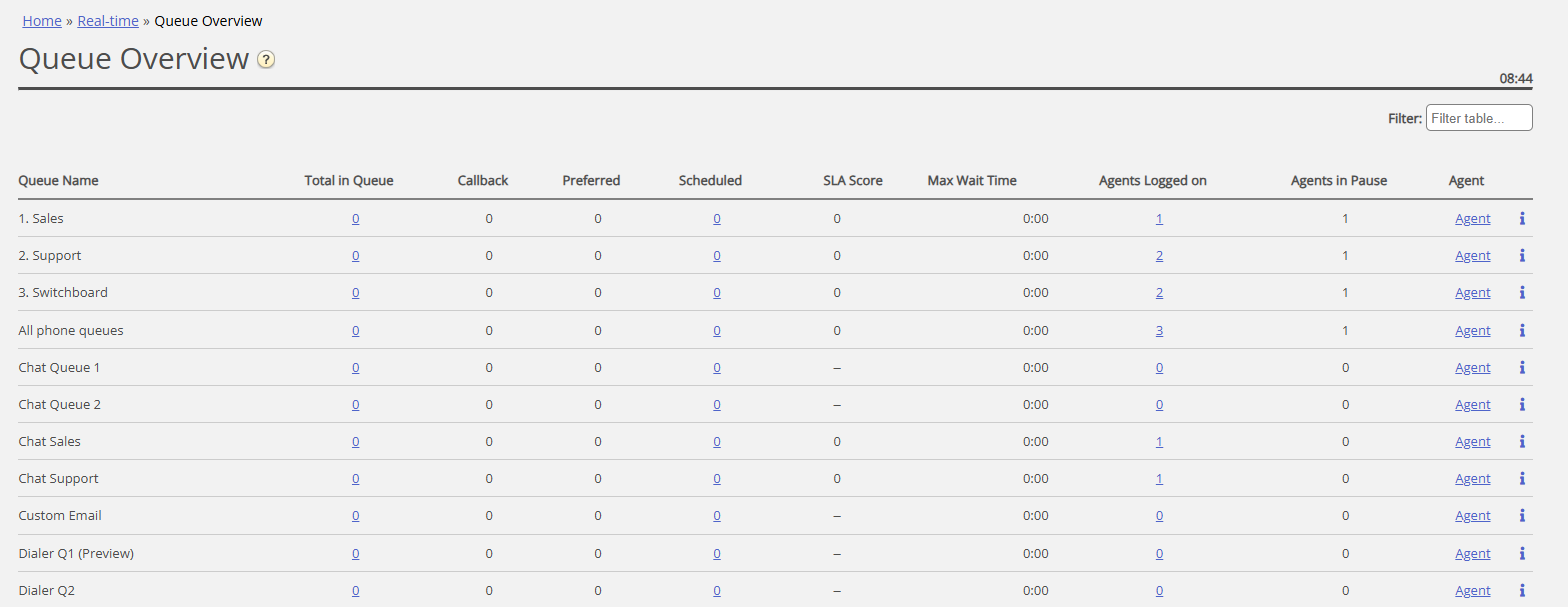
Columns in Queue Overview:
- Queue name: Name of Display queue (that contains 1 or more system queues)
- Total in queue: Total number of requests currently queued in the system queue(s) shown in this Display Queue. If you click on a number, the Queue Details page opens, showing one row per request in queue.
- Callback: Number of requests in the queue that are callbacks (for Phone queues)
- Preferred: Number of requests in the queue that have a reserved/preferred agent
- Scheduled: Number of scheduled calls/scheduled tasks that have not yet reached their Scheduled time. Aka the queue's "waiting room". If you click on a number, the Scheduled requests view opens, showing one row per request currently waiting for their Scheduled time.
(This column is only shown if the Queue property 'Show in Queue overview: Scheduled requests' is ON.) - SLA score: The highest SLA score for a request in a system queue included in this Display queue now. For details, see SLA under System Queue Settings.
- Max wait time: Longest waiting time for a request currently in a system queue included in the Display queue.
- Agents logged on*: Number of agents logged on who can answer requests in (have skills on) at least one of the system queues included in the Display queue, including agents in Pause.
- Agents in Pause: Number of agents that are in Pause.
- Agent: If you click on the Agent link, the Agent details view opens
If a user should not be able to see Queue details and Agent details, property 'Show link to agent and queue details' can be turned off. i: If you click on the 'i' for a Display queue row, a small window showing a number of agents logged on and in pause per system queue included in this Display queue. This info might be very useful for the Display queues consisting of multiple system queues.
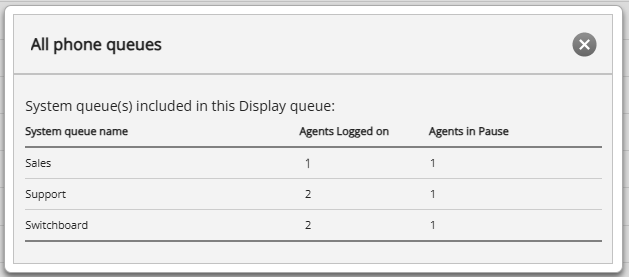

* Please note that if you have a Display queue containing several system queues, and the Queue overview (and underlying Agent details) says e.g. 5 agents logged on to this Display queue, this is not a guarantee that at least 1 agent is logged on to all system queues included in this Display queue. Click the 'i' to see details.
In some columns you will see hyperlinks to pages with more detailed information:
- By clicking on a number in the 'Total in queue' column, Queue details opens
- By clicking on a number in the Scheduled column, Scheduled requests opens
- By clicking on a number in the 'Agents Logged on' column, Agent status opens
- By clicking on 'Agent' in the Agent column, the Agent details opens